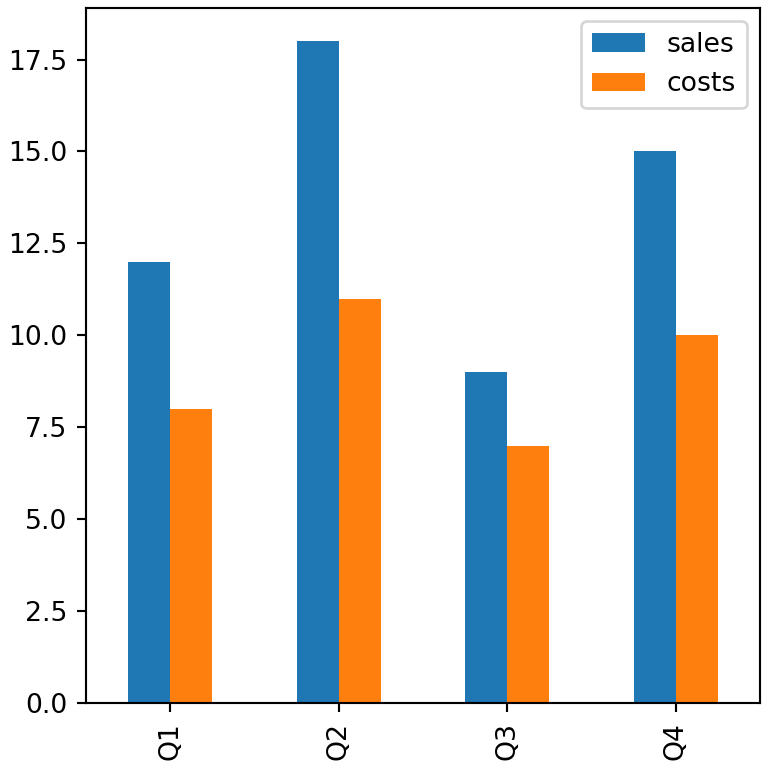
pandas uses the default matplotlib colors. Change them with the color argument, which accepts any matplotlib color, or with colormap.
Colors with color
Pass a single color for one series or a list of colors, one for each column, in the same order.
import pandas as pd
import matplotlib.pyplot as plt

df = pd.DataFrame({"Renewable": [30, 34, 38, 42, 46],
                   "Fossil": [62, 58, 54, 50, 45]},
                  index = [2021, 2022, 2023, 2024, 2025])

df.plot.bar(color = ["#2A9D8F", "#6D6875"], rot = 0)
# plt.show()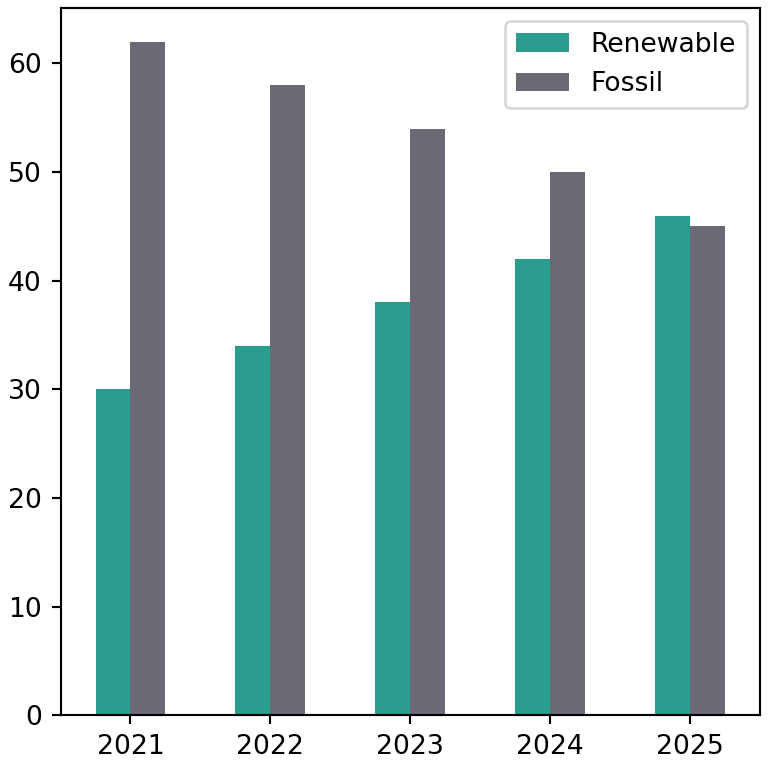
Colors with a dictionary
A dictionary maps each column to a color, so the result doesn’t depend on the order of the columns.
import pandas as pd
import matplotlib.pyplot as plt

df = pd.DataFrame({"Renewable": [30, 34, 38, 42, 46],
                   "Fossil": [62, 58, 54, 50, 45]},
                  index = [2021, 2022, 2023, 2024, 2025])

df.plot(color = {"Renewable": "green", "Fossil": "black"}, linewidth = 3)
# plt.show()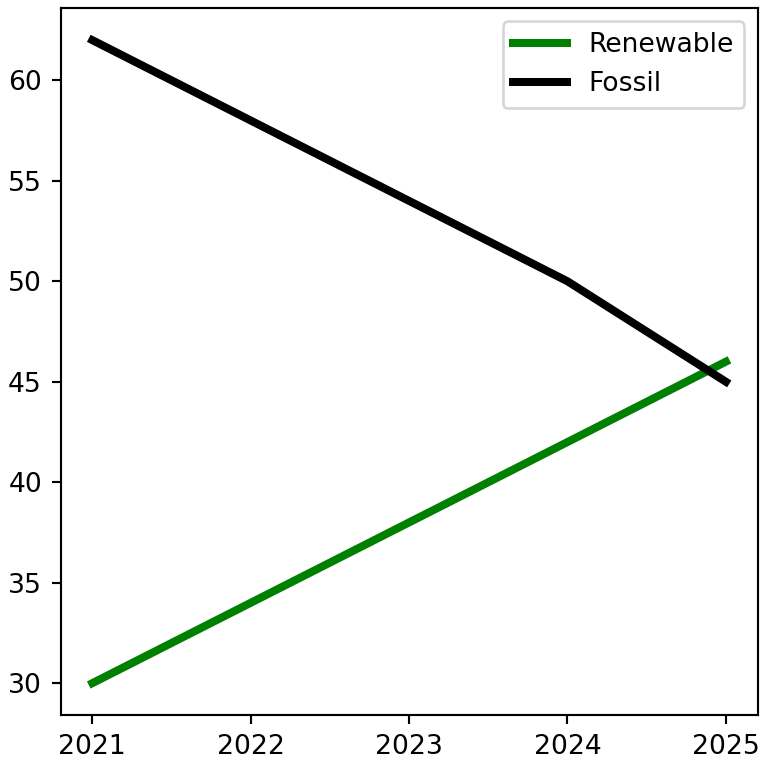
Colormaps
colormap takes the colors from a matplotlib colormap, which is very convenient when there are many columns.
import numpy as np
import pandas as pd
import matplotlib.pyplot as plt

budget = pd.DataFrame(np.random.default_rng(4).uniform(1, 10, (4, 6)),
                      columns = ["Rent", "Food", "Transport", "Leisure", "Health", "Other"],
                      index = ["Q1", "Q2", "Q3", "Q4"])

budget.plot.bar(stacked = True, colormap = "viridis", rot = 0)
# plt.show()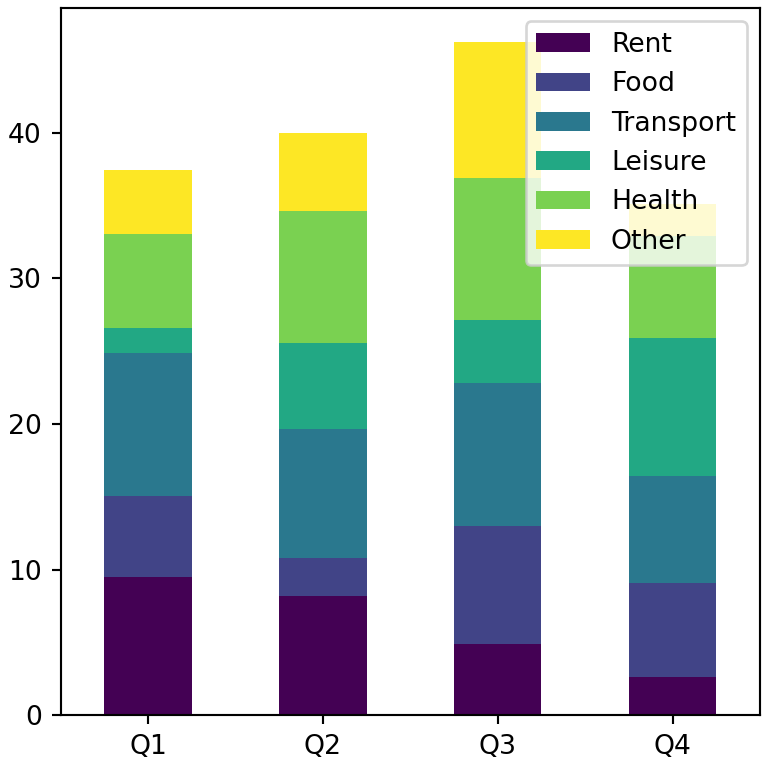
A different color for each bar
In a bar chart of a single Series the list of colors is applied bar by bar. This allows highlighting some bars.
import pandas as pd
import matplotlib.pyplot as plt

s = pd.Series([48, 68, 59, 84, 38], index = ["Spain", "France", "Italy", "Germany", "Poland"])
colors = ["tab:red" if v == s.max() else "lightgray" for v in s]

s.plot.bar(color = colors, rot = 0)
# plt.show()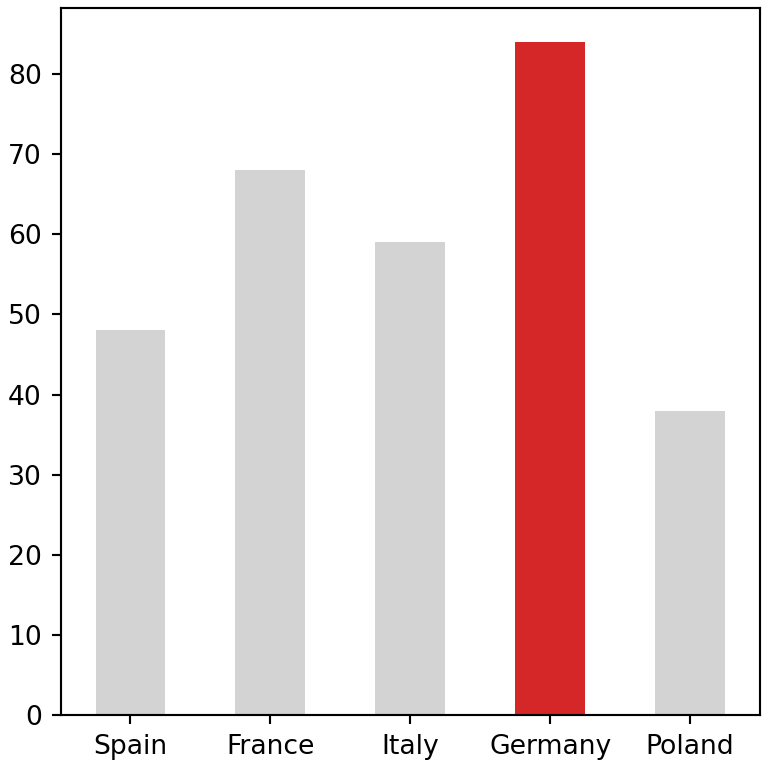
Transparency
The alpha argument, between 0 and 1, sets the transparency of all the elements.
import pandas as pd
import matplotlib.pyplot as plt

df = pd.DataFrame({"Renewable": [30, 34, 38, 42, 46],
                   "Fossil": [62, 58, 54, 50, 45]},
                  index = [2021, 2022, 2023, 2024, 2025])

df.plot.area(stacked = False, alpha = 0.3)
# plt.show()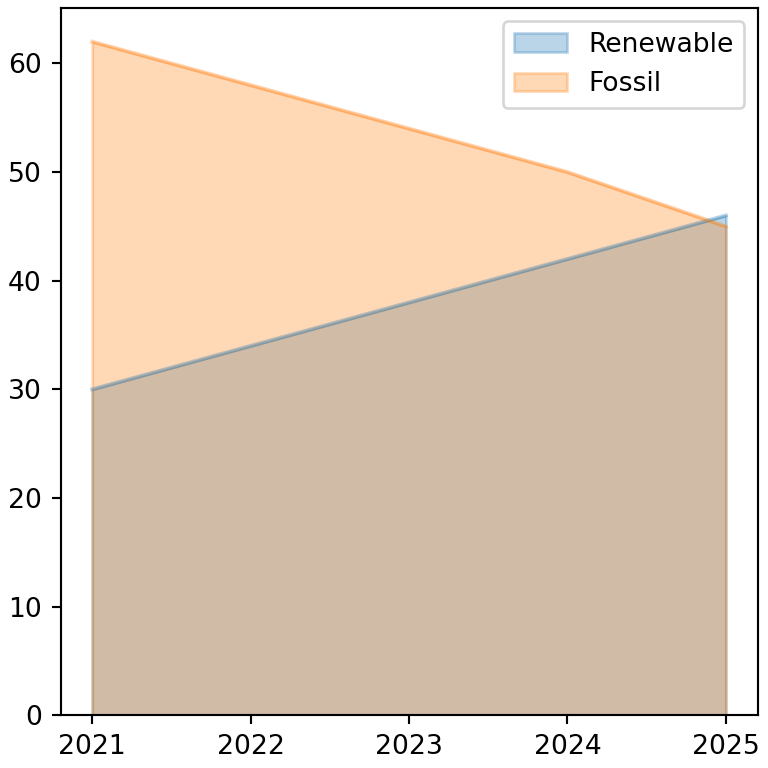
Check the full list of named colors and colormaps available in matplotlib.