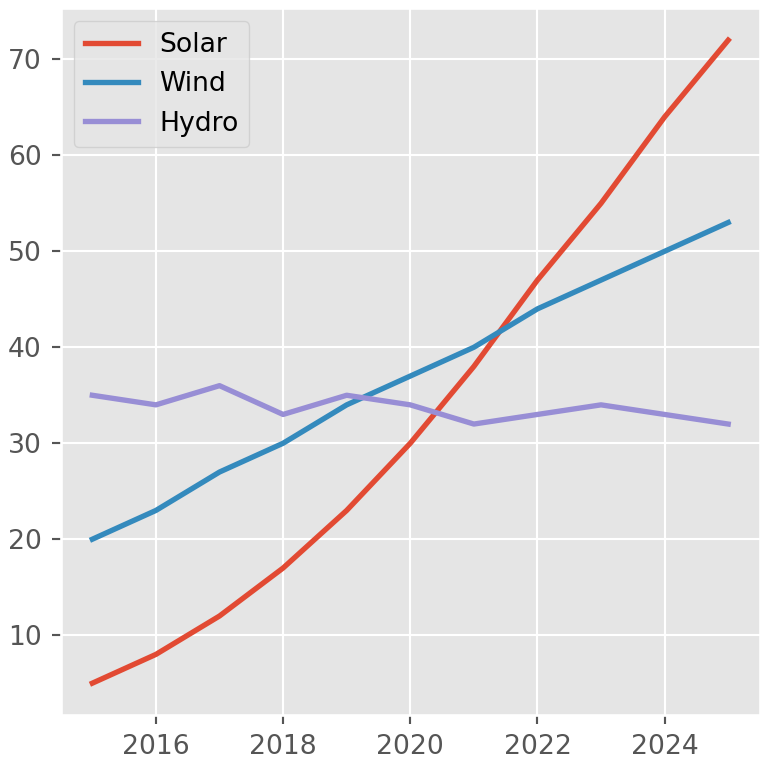
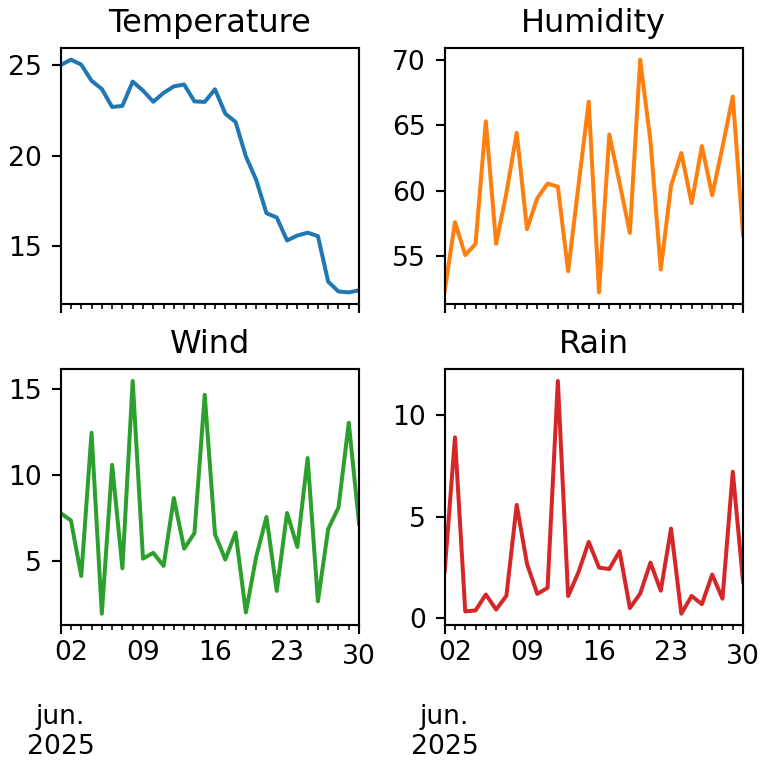
pandas adds a legend automatically when a chart has several columns. The labels of the legend are the names of the columns and the legend can be customized with the legend argument of plot and with the legend method of matplotlib.
Legend position
Call ax.legend on the axes returned by plot to change the position of the legend with loc.
import pandas as pd
import matplotlib.pyplot as plt

df = pd.DataFrame({"Laptops": [120, 135, 150, 145, 170, 190],
                   "Phones": [200, 210, 190, 230, 250, 270],
                   "Tablets": [80, 75, 90, 85, 95, 100]},
                  index = ["Jan", "Feb", "Mar", "Apr", "May", "Jun"])

ax = df.plot(marker = "o")
ax.legend(loc = "upper left")
# plt.show()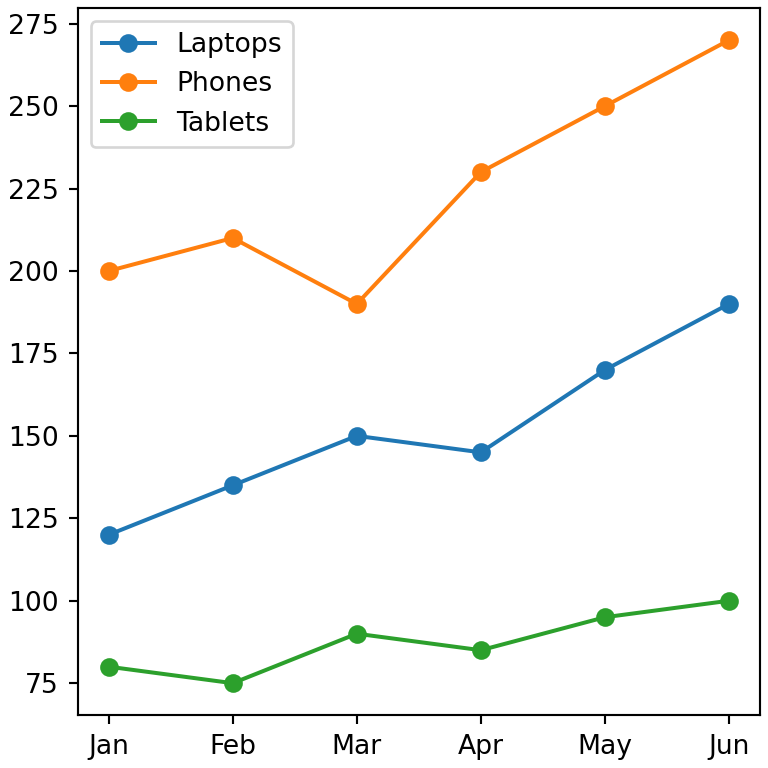
Legend outside the plot
Combine loc with bbox_to_anchor to place the legend outside the plot.
import pandas as pd
import matplotlib.pyplot as plt

df = pd.DataFrame({"Laptops": [120, 135, 150, 145, 170, 190],
                   "Phones": [200, 210, 190, 230, 250, 270],
                   "Tablets": [80, 75, 90, 85, 95, 100]},
                  index = ["Jan", "Feb", "Mar", "Apr", "May", "Jun"])

ax = df.plot(marker = "o", linewidth = 2)
ax.legend(title = "Product", loc = "upper left", bbox_to_anchor = (1, 1),
          fontsize = 12, title_fontsize = 13)
# plt.show()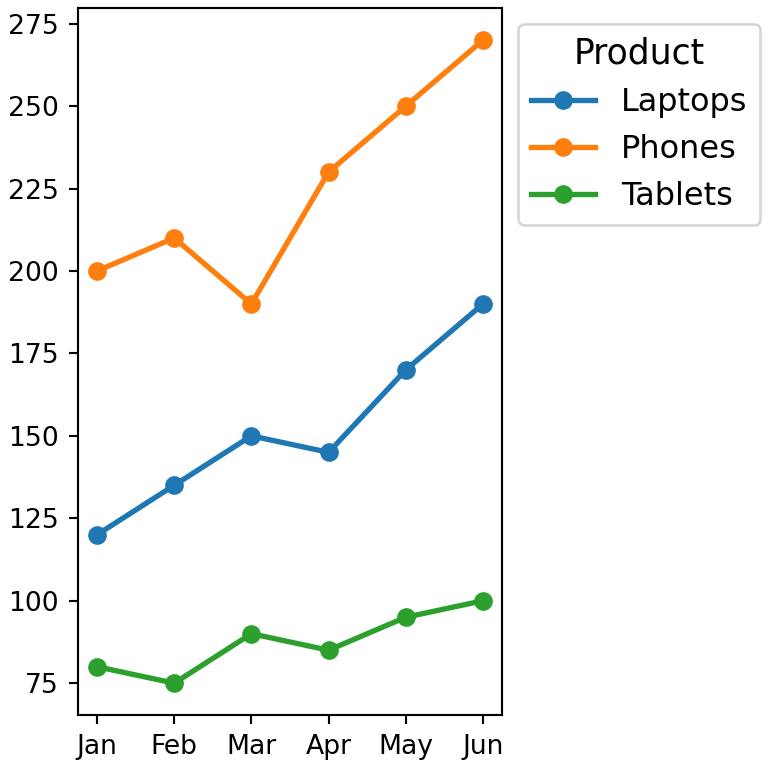
Change the labels
The simplest way to change the labels is renaming the columns before plotting them.
import pandas as pd
import matplotlib.pyplot as plt

df = pd.DataFrame({"Laptops": [120, 135, 150, 145, 170, 190],
                   "Phones": [200, 210, 190, 230, 250, 270],
                   "Tablets": [80, 75, 90, 85, 95, 100]},
                  index = ["Jan", "Feb", "Mar", "Apr", "May", "Jun"])

df.rename(columns = {"Laptops": "Laptop sales", "Phones": "Phone sales",
                   "Tablets": "Tablet sales"}).plot()
# plt.show()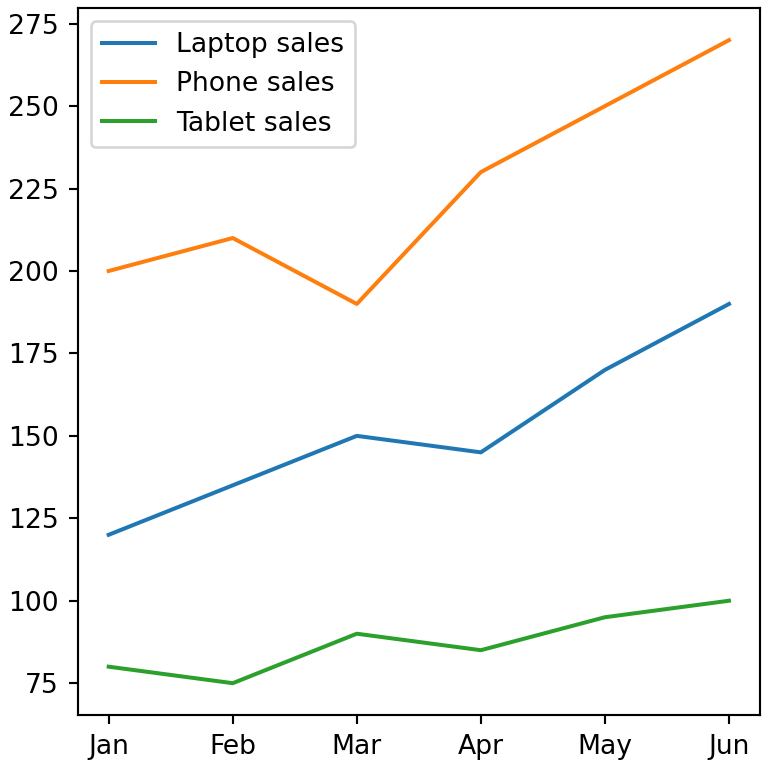
Legend title
Add a title to the legend with the title argument of ax.legend.
import pandas as pd
import matplotlib.pyplot as plt

df = pd.DataFrame({"Laptops": [120, 135, 150, 145, 170, 190],
                   "Phones": [200, 210, 190, 230, 250, 270],
                   "Tablets": [80, 75, 90, 85, 95, 100]},
                  index = ["Jan", "Feb", "Mar", "Apr", "May", "Jun"])

ax = df.plot()
ax.legend(title = "Product", ncol = 3)
# plt.show()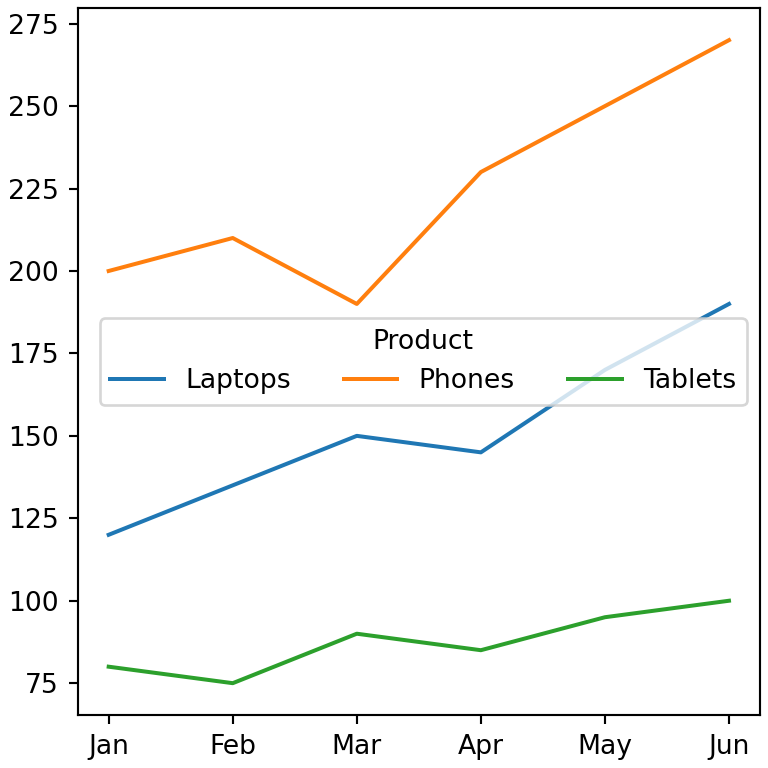
Reverse the order
Set legend = "reverse" to show the items in reverse order. This is useful in stacked charts, so the order of the legend matches the order of the stack.
import pandas as pd
import matplotlib.pyplot as plt

df = pd.DataFrame({"Laptops": [120, 135, 150, 145, 170, 190],
                   "Phones": [200, 210, 190, 230, 250, 270],
                   "Tablets": [80, 75, 90, 85, 95, 100]},
                  index = ["Jan", "Feb", "Mar", "Apr", "May", "Jun"])

df.plot.bar(stacked = True, legend = "reverse", rot = 0)
# plt.show()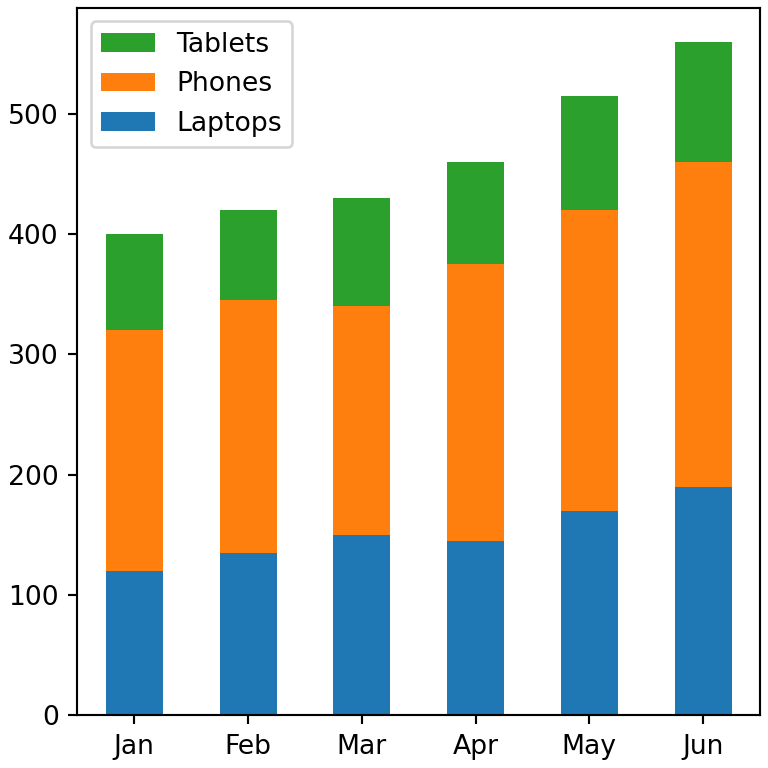
Remove the legend
Set legend = False to create the chart without legend.
import pandas as pd
import matplotlib.pyplot as plt

df = pd.DataFrame({"Laptops": [120, 135, 150, 145, 170, 190],
                   "Phones": [200, 210, 190, 230, 250, 270],
                   "Tablets": [80, 75, 90, 85, 95, 100]},
                  index = ["Jan", "Feb", "Mar", "Apr", "May", "Jun"])

df.plot(legend = False)
# plt.show()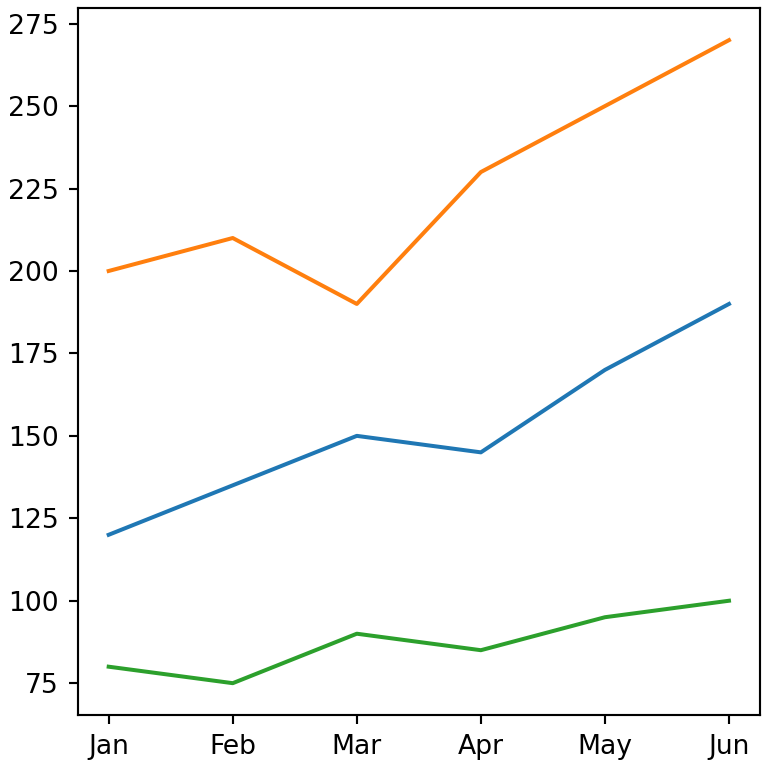
See the legend in matplotlib tutorial for the rest of options of the legend.