pandas can split the columns of a data frame in several subplots with a single argument. For more complex layouts create the subplots with matplotlib and pass each axes to plot.
One subplot per column
Set subplots = True to draw each column in its own subplot.
import numpy as np
import pandas as pd
import matplotlib.pyplot as plt

rng = np.random.default_rng(7)
df = pd.DataFrame({"Temperature": 25 + rng.normal(0, 1, 30).cumsum(),
                   "Humidity": 60 + rng.normal(0, 5, 30),
                   "Wind": rng.gamma(2, 4, 30),
                   "Rain": rng.exponential(2, 30)},
                  index = pd.date_range("2025-06-01", periods = 30))

df.plot(subplots = True)
# plt.show()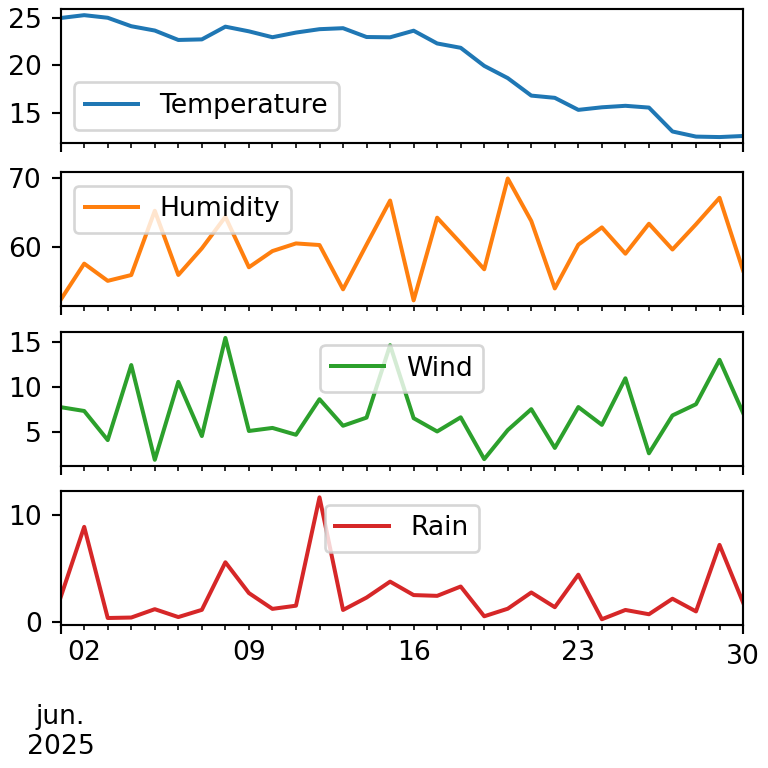
Layout of the subplots
layout sets the number of rows and columns of the grid. Use -1 to compute one of the dimensions automatically.
import numpy as np
import pandas as pd
import matplotlib.pyplot as plt

rng = np.random.default_rng(7)
df = pd.DataFrame({"Temperature": 25 + rng.normal(0, 1, 30).cumsum(),
                   "Humidity": 60 + rng.normal(0, 5, 30),
                   "Wind": rng.gamma(2, 4, 30),
                   "Rain": rng.exponential(2, 30)},
                  index = pd.date_range("2025-06-01", periods = 30))

df.plot(subplots = True, layout = (2, 2), legend = False,
        title = list(df.columns))
# plt.show()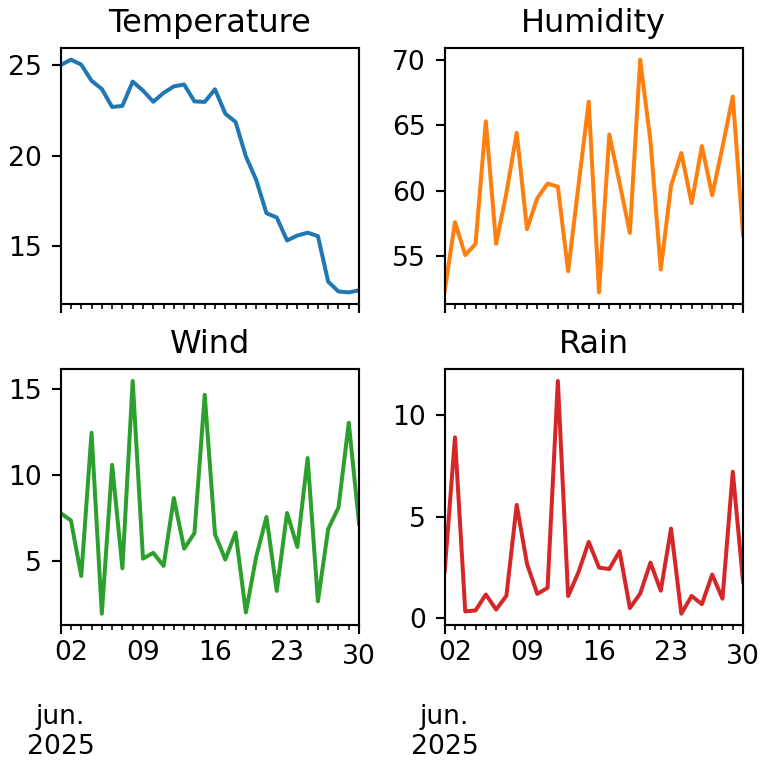
Share the axes
sharex and sharey use the same limits in all the subplots, which makes it easier to compare them.
import numpy as np
import pandas as pd
import matplotlib.pyplot as plt

rng = np.random.default_rng(7)
df = pd.DataFrame({"Temperature": 25 + rng.normal(0, 1, 30).cumsum(),
                   "Humidity": 60 + rng.normal(0, 5, 30),
                   "Wind": rng.gamma(2, 4, 30),
                   "Rain": rng.exponential(2, 30)},
                  index = pd.date_range("2025-06-01", periods = 30))

df[["Wind", "Rain"]].plot(subplots = True, layout = (1, 2), sharey = True)
# plt.show()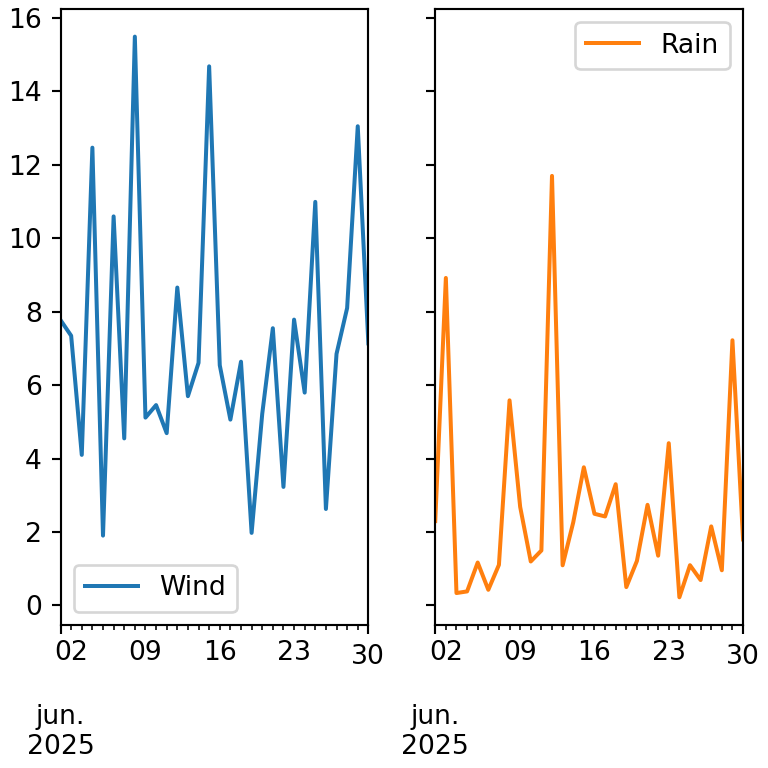
Several columns in the same subplot
Since pandas 2.0 subplots also accepts a list of tuples to group several columns in the same subplot.
import numpy as np
import pandas as pd
import matplotlib.pyplot as plt

rng = np.random.default_rng(7)
df = pd.DataFrame({"Temperature": 25 + rng.normal(0, 1, 30).cumsum(),
                   "Humidity": 60 + rng.normal(0, 5, 30),
                   "Wind": rng.gamma(2, 4, 30),
                   "Rain": rng.exponential(2, 30)},
                  index = pd.date_range("2025-06-01", periods = 30))

df.plot(subplots = [("Wind", "Rain")], layout = (3, 1))
# plt.show()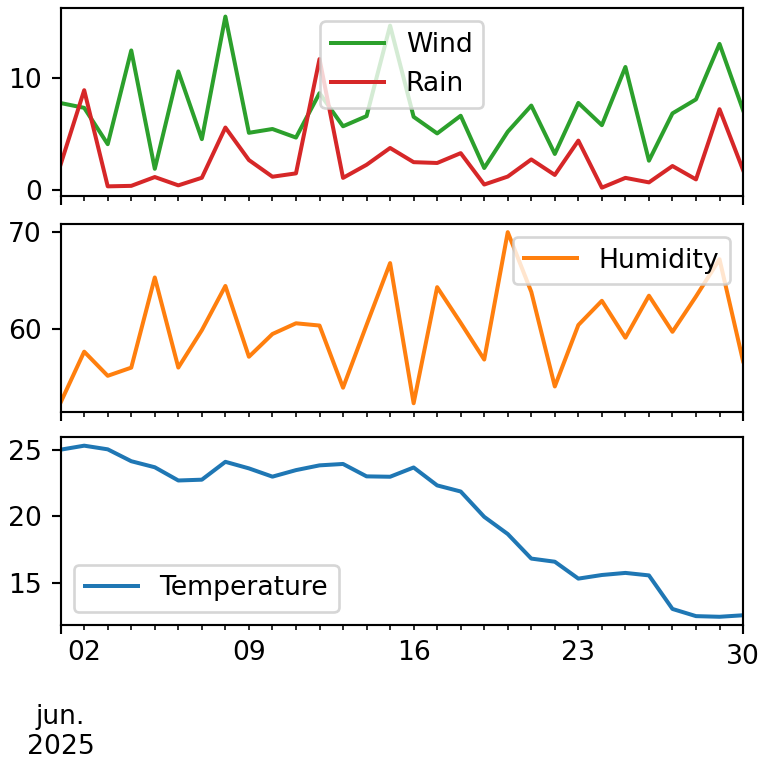
Plot into existing axes
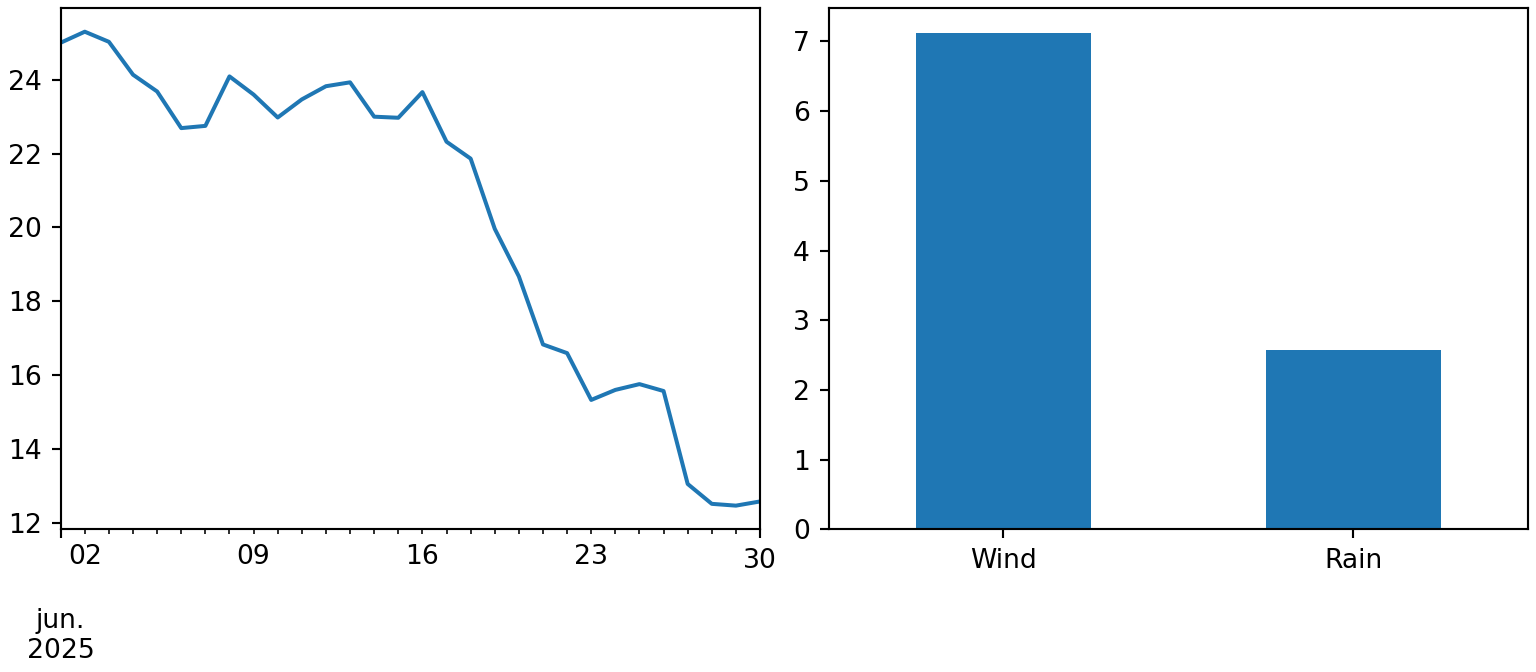
Create the subplots with plt.subplots and pass each axes to the ax argument. This allows combining different types of charts in the same figure.
import numpy as np
import pandas as pd
import matplotlib.pyplot as plt

rng = np.random.default_rng(7)
df = pd.DataFrame({"Temperature": 25 + rng.normal(0, 1, 30).cumsum(),
                   "Humidity": 60 + rng.normal(0, 5, 30),
                   "Wind": rng.gamma(2, 4, 30),
                   "Rain": rng.exponential(2, 30)},
                  index = pd.date_range("2025-06-01", periods = 30))

fig, (ax1, ax2) = plt.subplots(1, 2, figsize = (8, 3.5))

df["Temperature"].plot(ax = ax1)
df[["Wind", "Rain"]].mean().plot.bar(ax = ax2, rot = 0)
# plt.show()
Learn more about how to create and customize subplots in matplotlib.