The plot method of pandas includes several arguments to customize the axes: limits, ticks, rotation and scale. Anything else can be changed with matplotlib on the axes returned by plot.
Axis limits
Set the limits of the axes with xlim and ylim, passing a tuple with the minimum and the maximum.
import pandas as pd
import matplotlib.pyplot as plt

df = pd.DataFrame({"users": [1200, 2600, 5900, 14000, 31000, 72000, 160000, 350000]},
                  index = range(2018, 2026))

df.plot(marker = "o", ylim = (0, 400000), xlim = (2017.5, 2025.5))
# plt.show()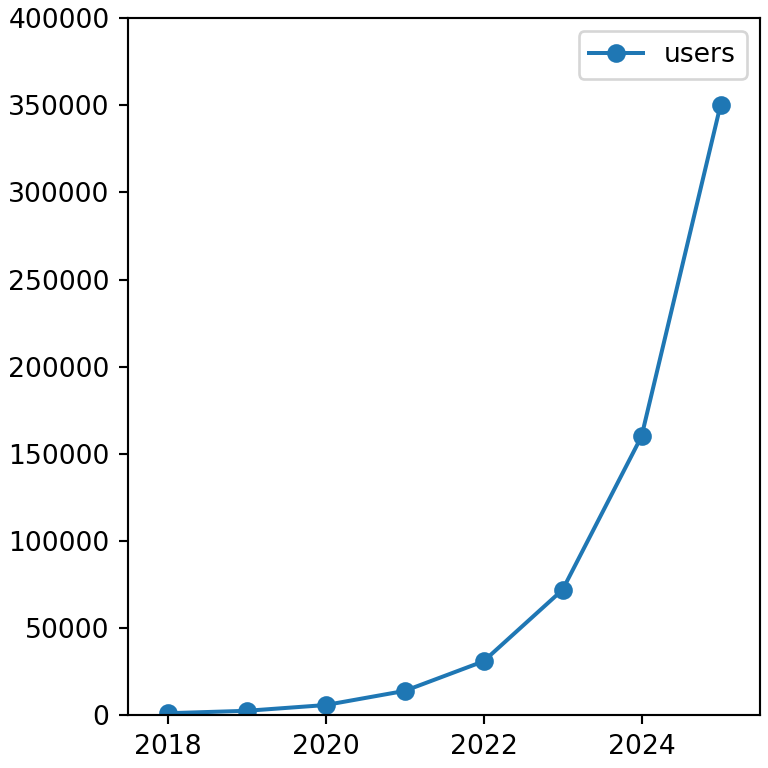
Ticks and tick labels
xticks and yticks set the position of the ticks, rot rotates the labels of the X axis and fontsize changes the size of the tick labels.
import pandas as pd
import matplotlib.pyplot as plt

df = pd.DataFrame({"users": [1200, 2600, 5900, 14000, 31000, 72000, 160000, 350000]},
                  index = range(2018, 2026))

df.plot.bar(yticks = [0, 100000, 200000, 300000], rot = 45, fontsize = 12)
# plt.show()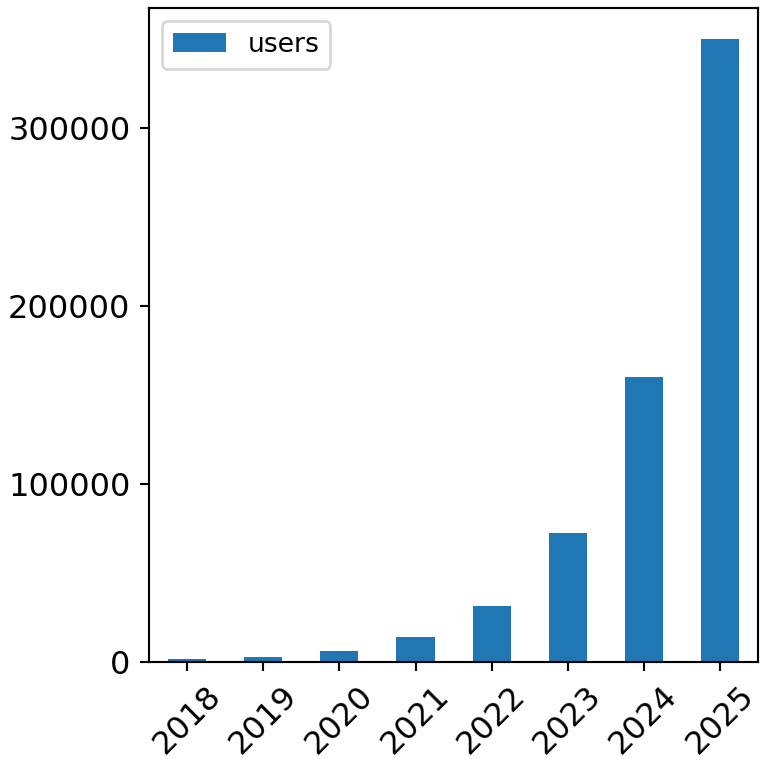
Logarithmic scale
Use logy = True for a logarithmic Y axis, logx = True for the X axis or loglog = True for both.
import pandas as pd
import matplotlib.pyplot as plt

df = pd.DataFrame({"users": [1200, 2600, 5900, 14000, 31000, 72000, 160000, 350000]},
                  index = range(2018, 2026))

df.plot(logy = True, marker = "o", grid = True)
# plt.show()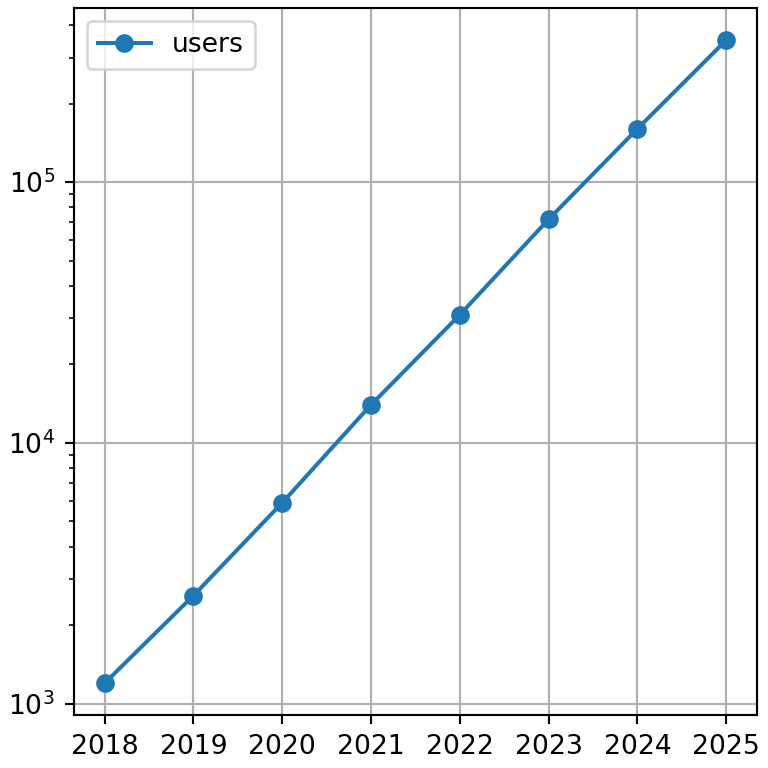
Format the axis numbers
To format the numbers of the axes, for example as percentages or with thousands separators, use the formatters of matplotlib.ticker on the axes returned by plot.
import pandas as pd
import matplotlib.pyplot as plt

df = pd.DataFrame({"users": [1200, 2600, 5900, 14000, 31000, 72000, 160000, 350000]},
                  index = range(2018, 2026))
from matplotlib.ticker import StrMethodFormatter

ax = df.plot.bar(rot = 0)
ax.yaxis.set_major_formatter(StrMethodFormatter("{x:,.0f}"))
# plt.show()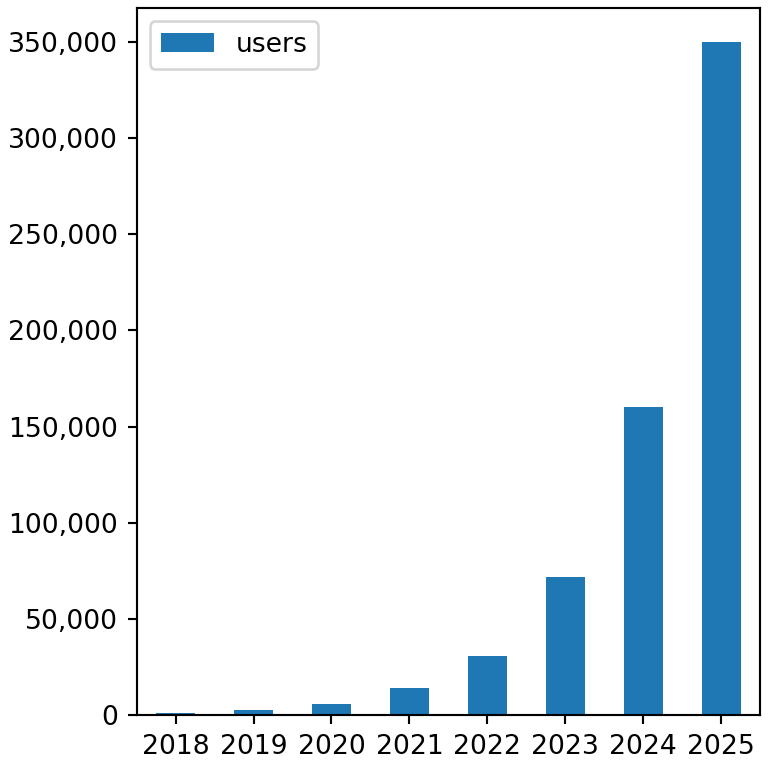
Grid and borders
Add a grid with grid = True and remove the top and right borders with matplotlib.
import pandas as pd
import matplotlib.pyplot as plt

df = pd.DataFrame({"users": [1200, 2600, 5900, 14000, 31000, 72000, 160000, 350000]},
                  index = range(2018, 2026))

ax = df.plot(marker = "o", grid = True)
ax.spines[["top", "right"]].set_visible(False)
# plt.show()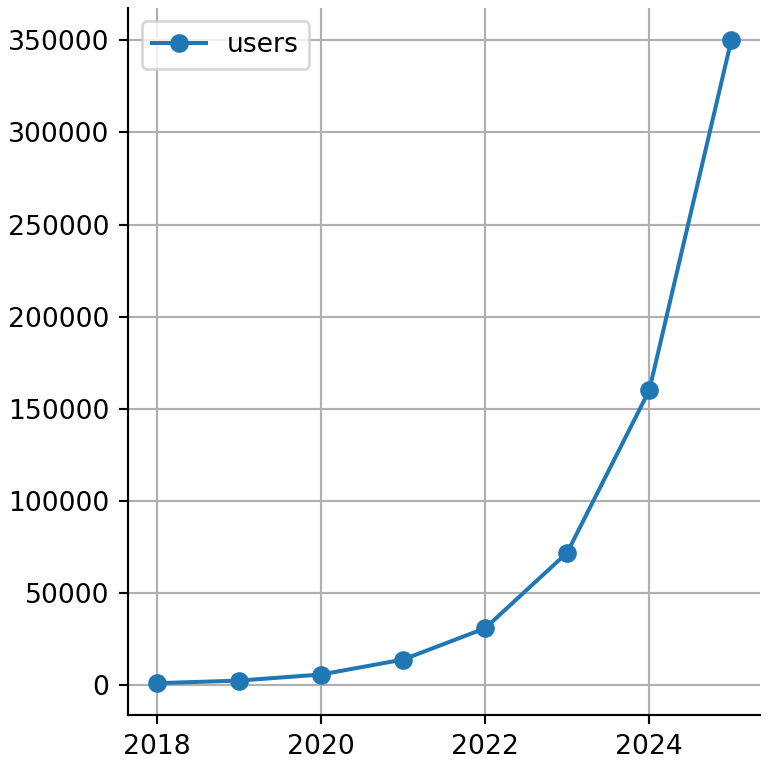
To customize the date axis of time series see the date axis in matplotlib tutorial and for more axis options the axis customization in matplotlib tutorial.