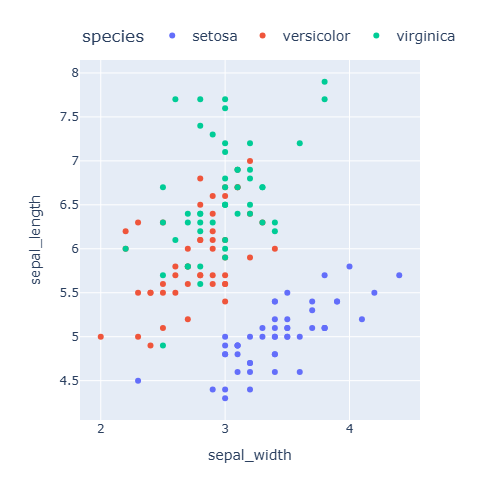
There are two ways to combine several charts in a plotly figure: the facet_col and facet_row arguments of Plotly Express, which split the data by groups, and the make_subplots function, which allows combining any type of chart.
Facets with Plotly Express
facet_col creates a subplot for each group of a variable in different columns and facet_row in different rows. facet_col_wrap sets the maximum number of columns.
import plotly.express as px

df = px.data.tips()

fig = px.scatter(df, x = "total_bill", y = "tip",
                 facet_col = "time")

fig.show()
Subplots with make_subplots
Create the grid with make_subplots and add each trace with add_trace, specifying its row and col. Traces are created with plotly.graph_objects.
import plotly.graph_objects as go
from plotly.subplots import make_subplots

fig = make_subplots(rows = 2, cols = 2,
                    subplot_titles = ["Line", "Bar", "Scatter", "Histogram"])

fig.add_trace(go.Scatter(y = [1, 3, 2, 4], mode = "lines"), row = 1, col = 1)
fig.add_trace(go.Bar(x = ["A", "B", "C"], y = [3, 5, 2]), row = 1, col = 2)
fig.add_trace(go.Scatter(x = [1, 2, 3, 4], y = [4, 1, 3, 2], mode = "markers"), row = 2, col = 1)
fig.add_trace(go.Histogram(x = [1, 2, 2, 3, 3, 3, 4, 4, 5]), row = 2, col = 2)

fig.update_layout(showlegend = False)
fig.show()
Shared axes and spacing
shared_xaxes and shared_yaxes use the same scale in all subplots, while horizontal_spacing and vertical_spacing control the space between them (as a fraction of the figure).
import plotly.graph_objects as go
from plotly.subplots import make_subplots

fig = make_subplots(rows = 2, cols = 1, shared_xaxes = True,
                    vertical_spacing = 0.05)

fig.add_trace(go.Scatter(y = [1, 3, 2, 4, 3]), row = 1, col = 1)
fig.add_trace(go.Bar(y = [5, 2, 4, 1, 3]), row = 2, col = 1)

fig.update_layout(showlegend = False)
fig.show()
Different sizes
column_widths and row_heights set the relative size of each column and row.
import plotly.graph_objects as go
from plotly.subplots import make_subplots

fig = make_subplots(rows = 1, cols = 2, column_widths = [0.7, 0.3])

fig.add_trace(go.Scatter(y = [1, 3, 2, 4, 3, 5]), row = 1, col = 1)
fig.add_trace(go.Box(y = [1, 3, 2, 4, 3, 5]), row = 1, col = 2)

fig.update_layout(showlegend = False)
fig.show()
Secondary Y axis
To plot two variables with different scales on the same chart, enable a secondary Y axis with specs and add the trace with secondary_y = True.
import plotly.graph_objects as go
from plotly.subplots import make_subplots

fig = make_subplots(specs = [[{"secondary_y": True}]])

fig.add_trace(go.Bar(x = [1, 2, 3, 4], y = [10, 15, 12, 18], name = "Sales"))
fig.add_trace(go.Scatter(x = [1, 2, 3, 4], y = [0.2, 0.25, 0.22, 0.3], name = "Margin"),
              secondary_y = True)

fig.update_yaxes(title_text = "Sales", secondary_y = False)
fig.update_yaxes(title_text = "Margin", tickformat = ".0%", secondary_y = True)
fig.show()
To change the size of the whole figure see the plotly themes and layout tutorial.