Plotly Express functions provide a title argument to add a title directly when creating the chart. For further customization use fig.update_layout, which gives access to the position, font and other properties of the title.
Adding a title
Pass the text to the title argument of any Plotly Express function.
import plotly.express as px

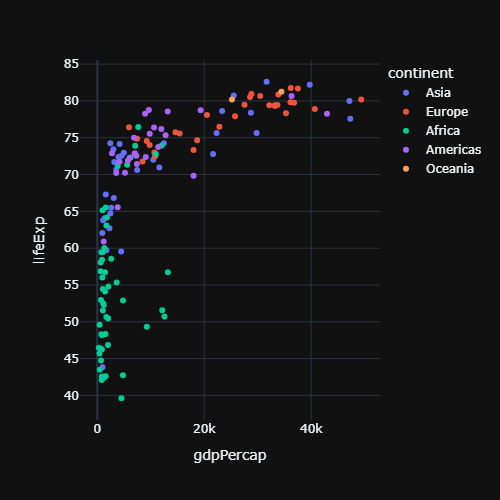
df = px.data.gapminder().query("year == 2007")

fig = px.scatter(df, x = "gdpPercap", y = "lifeExp",
                 title = "Life expectancy vs GDP per capita")

fig.show()
Title position
By default the title is aligned to the left. Use title_x (between 0 and 1) to change its horizontal position, for example 0.5 to center it, and title_y for the vertical position.
import plotly.express as px

df = px.data.gapminder().query("year == 2007")

fig = px.scatter(df, x = "gdpPercap", y = "lifeExp",
                 title = "Life expectancy vs GDP per capita")

fig.update_layout(title_x = 0.5)

fig.show()
Title font, size and color
Customize the text with title_font_size, title_font_color and title_font_family. The same properties can be set with a dictionary: title = dict(text = ..., font = dict(...)).
import plotly.express as px

df = px.data.gapminder().query("year == 2007")

fig = px.scatter(df, x = "gdpPercap", y = "lifeExp",
                 title = "Life expectancy vs GDP per capita")

fig.update_layout(title_font_size = 24,
                  title_font_color = "darkblue",
                  title_font_family = "Georgia")

fig.show()
Bold and HTML tags
Plotly titles support some HTML tags, such as <b> (bold), <i> (italic) or <br> (line break).
import plotly.express as px

df = px.data.gapminder().query("year == 2007")

fig = px.scatter(df, x = "gdpPercap", y = "lifeExp",
                 title = "<b>Life expectancy</b><br>Year 2007")

fig.show()
Subtitle
Since plotly 5.24 the title has a subtitle property, which is displayed below the main title with a smaller font.
import plotly.express as px

df = px.data.gapminder().query("year == 2007")

fig = px.scatter(df, x = "gdpPercap", y = "lifeExp")

fig.update_layout(title = dict(text = "Life expectancy vs GDP per capita",
                               subtitle = dict(text = "Data from 2007")))

fig.show()
Axis titles
Plotly Express uses the column names as axis titles. Change them with the labels argument, which maps each column to a new name, or with update_xaxes and update_yaxes.
import plotly.express as px

df = px.data.gapminder().query("year == 2007")

fig = px.scatter(df, x = "gdpPercap", y = "lifeExp",
                 labels = {"gdpPercap": "GDP per capita",
                           "lifeExp": "Life expectancy"})

fig.show()
The labels argument also renames the variables in the legend and in the hover labels. Learn more about the axes in the axis customization in plotly tutorial.