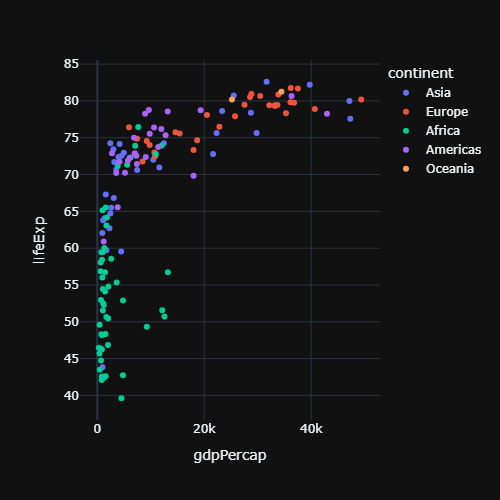
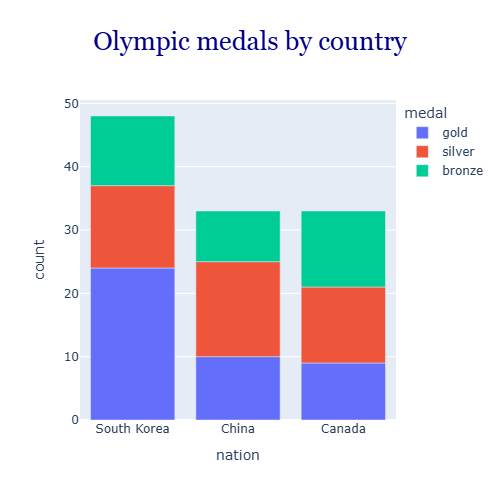
Plotly adds a legend automatically when the data is grouped, for instance with the color argument of Plotly Express. The legend is interactive: click an item to hide that group and double click to isolate it. Its appearance is customized with fig.update_layout.
Default legend
import plotly.express as px

df = px.data.gapminder().query("year == 2007")

fig = px.scatter(df, x = "gdpPercap", y = "lifeExp",
                 color = "continent")

fig.show()
Legend position
The position of the legend is set with legend_x and legend_y in normalized coordinates, where (0, 0) is the bottom left corner of the plot and (1, 1) the top right corner. legend_xanchor and legend_yanchor specify which part of the legend is placed at those coordinates.
import plotly.express as px

df = px.data.gapminder().query("year == 2007")

fig = px.scatter(df, x = "gdpPercap", y = "lifeExp", color = "continent")

fig.update_layout(legend = dict(x = 0.99, y = 0.01,
                                xanchor = "right", yanchor = "bottom"))

fig.show()
Horizontal legend
With orientation = "h" the items are displayed horizontally, which is very useful to place the legend above or below the plot and leave more space for the data.
import plotly.express as px

df = px.data.gapminder().query("year == 2007")

fig = px.scatter(df, x = "gdpPercap", y = "lifeExp", color = "continent")

fig.update_layout(legend = dict(orientation = "h",
                                x = 0, y = 1.02, yanchor = "bottom"))

fig.show()
Legend title
By default the title is the name of the grouping column. Change it with legend_title_text or remove it with an empty string.
import plotly.express as px

df = px.data.gapminder().query("year == 2007")

fig = px.scatter(df, x = "gdpPercap", y = "lifeExp", color = "continent")

fig.update_layout(legend_title_text = "Continents")

fig.show()
Font, background and border
Use font to change the text of the legend and bgcolor, bordercolor and borderwidth to customize its box.
import plotly.express as px

df = px.data.gapminder().query("year == 2007")

fig = px.scatter(df, x = "gdpPercap", y = "lifeExp", color = "continent")

fig.update_layout(legend = dict(font = dict(size = 14, color = "black"),
                                bgcolor = "lightyellow",
                                bordercolor = "gray", borderwidth = 1))

fig.show()
Hide the legend
Set showlegend = False in update_layout to remove the whole legend. To hide only one series, use showlegend = False on that trace, for example with fig.update_traces(showlegend = False, selector = dict(name = "Asia")).
import plotly.express as px

df = px.data.gapminder().query("year == 2007")

fig = px.scatter(df, x = "gdpPercap", y = "lifeExp", color = "continent")

fig.update_layout(showlegend = False)

fig.show()
If the colors represent a numeric variable plotly shows a color bar instead of a legend. See the plotly color scales to change its colors.