The axes of plotly charts are customized with fig.update_xaxes and fig.update_yaxes. Both methods accept the same arguments and apply the changes to all the X or Y axes of the figure.
Axis range
Set the limits of an axis with range = [min, max].
import plotly.express as px

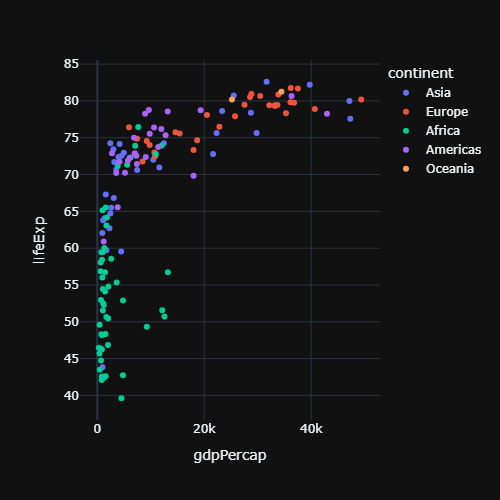
df = px.data.gapminder().query("year == 2007")

fig = px.scatter(df, x = "gdpPercap", y = "lifeExp")

fig.update_xaxes(range = [0, 30000])
fig.update_yaxes(range = [40, 90])

fig.show()
Logarithmic scale
Use type = "log" in update_xaxes or update_yaxes, or the log_x and log_y arguments of Plotly Express. Note that with a log scale the range is specified in powers of ten.
import plotly.express as px

df = px.data.gapminder().query("year == 2007")

fig = px.scatter(df, x = "gdpPercap", y = "lifeExp", log_x = True)

fig.show()
Ticks and tick labels
tickangle rotates the tick labels, dtick sets the interval between ticks and tickvals and ticktext set custom positions and labels.
import plotly.express as px

df = px.data.tips()

fig = px.histogram(df, x = "day", y = "total_bill")

fig.update_xaxes(tickangle = -45)

fig.show()
Custom ticks
import plotly.express as px

df = px.data.gapminder().query("year == 2007")

fig = px.scatter(df, x = "gdpPercap", y = "lifeExp")

fig.update_yaxes(tickvals = [40, 60, 80],
                 ticktext = ["Low", "Medium", "High"])

fig.show()
Tick format
tickformat uses the d3 format syntax: for instance ",.0f" adds thousands separators, ".0%" shows percentages and "%b %Y" formats dates. tickprefix and ticksuffix add a text before or after each value.
import plotly.express as px

df = px.data.gapminder().query("year == 2007")

fig = px.scatter(df, x = "gdpPercap", y = "lifeExp")

fig.update_xaxes(tickprefix = "$", tickformat = ",.0f")

fig.show()
Date axes
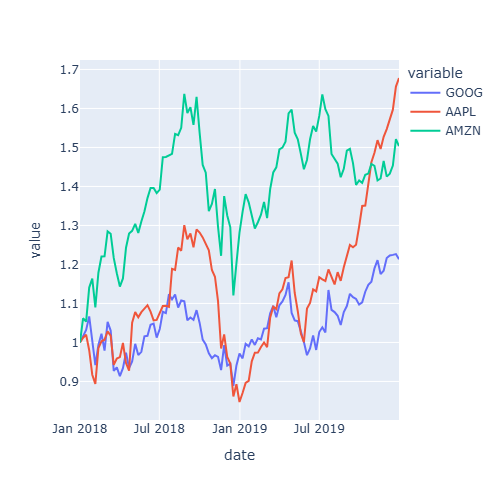
For date axes, dtick = "M3" places a tick every three months.
import plotly.express as px

df = px.data.stocks()

fig = px.line(df, x = "date", y = "GOOG")

fig.update_xaxes(dtick = "M3", tickformat = "%b<br>%Y")

fig.show()
Axis lines, grid and zero line
Show the axis lines with showline, hide or customize the grid with showgrid and gridcolor and control the line at zero with zeroline.
import plotly.express as px

df = px.data.gapminder().query("year == 2007")

fig = px.scatter(df, x = "gdpPercap", y = "lifeExp", template = "simple_white")

fig.update_xaxes(showline = True, linewidth = 2, linecolor = "black", mirror = True)
fig.update_yaxes(showline = True, linewidth = 2, linecolor = "black", mirror = True,
                 showgrid = True, gridcolor = "lightgray")

fig.show()
Reverse or hide an axis
autorange = "reversed" reverses an axis and visible = False hides it completely.
import plotly.express as px

df = px.data.tips()

fig = px.histogram(df, y = "day", x = "total_bill")

fig.update_yaxes(autorange = "reversed")
fig.update_xaxes(visible = False)

fig.show()
Learn how to add a second Y axis in the subplots in plotly tutorial.