The hover labels (also known as tooltips) are the boxes displayed when you move the mouse over the data of a plotly chart. Move the cursor over the charts of this tutorial to see the effect of each customization.
Add or remove data with hover_data and hover_name
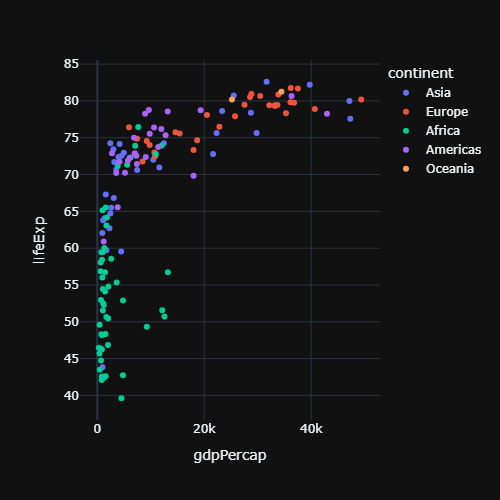
hover_name shows a column in bold at the top of the label and hover_data adds more columns. Pass a dictionary to hover_data to remove columns (False) or to format them.
import plotly.express as px

df = px.data.gapminder().query("year == 2007")

fig = px.scatter(df, x = "gdpPercap", y = "lifeExp",
                 hover_name = "country",
                 hover_data = {"pop": ":,", "gdpPercap": ":.0f"})

fig.show()
Custom labels with hovertemplate
hovertemplate defines the full text of the label. The variables are written between %{}, they accept formats such as %{y:.1f} and the content of <extra></extra> is displayed in a secondary box (leave it empty to remove it).
import plotly.express as px

df = px.data.gapminder().query("year == 2007")

fig = px.scatter(df, x = "gdpPercap", y = "lifeExp", hover_name = "country")

fig.update_traces(hovertemplate = "<b>%{hovertext}</b><br>" +
                                  "GDP: $%{x:,.0f}<br>" +
                                  "Life expectancy: %{y:.1f} years" +
                                  "<extra></extra>")

fig.show()
Hover mode
hovermode controls which points show a label. "x unified" displays a single label with the values of all the series at the same X value, which is very useful for time series. Other options are "x", "y", "closest" (the default) and False.
import plotly.express as px

df = px.data.stocks()

fig = px.line(df, x = "date", y = ["GOOG", "AAPL", "AMZN"])

fig.update_layout(hovermode = "x unified")

fig.show()
Hover label style
Change the background, the border and the font of the labels with hoverlabel.
import plotly.express as px

df = px.data.gapminder().query("year == 2007")

fig = px.scatter(df, x = "gdpPercap", y = "lifeExp", hover_name = "country")

fig.update_layout(hoverlabel = dict(bgcolor = "white",
                                    font_size = 14,
                                    font_family = "Courier New"))

fig.show()
Disable the hover labels
Set hoverinfo = "skip" on the traces to remove the labels of the chart, or hovermode = False in the layout.
import plotly.express as px

df = px.data.gapminder().query("year == 2007")

fig = px.scatter(df, x = "gdpPercap", y = "lifeExp")

fig.update_traces(hoverinfo = "skip", hovertemplate = None)

fig.show()
Learn how to add permanent texts to the charts in the annotations in plotly tutorial.