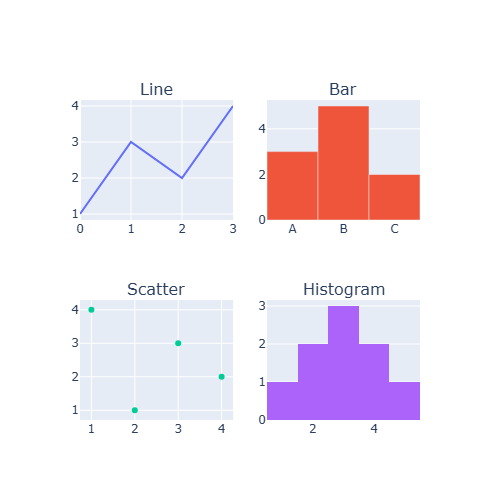
Plotly charts can be saved as interactive HTML files, which keep the zoom and the hover labels, or as static images for documents and presentations.
Interactive HTML with write_html
write_html saves the chart as a standalone web page that can be opened in any browser or embedded in a website.
import plotly.express as px

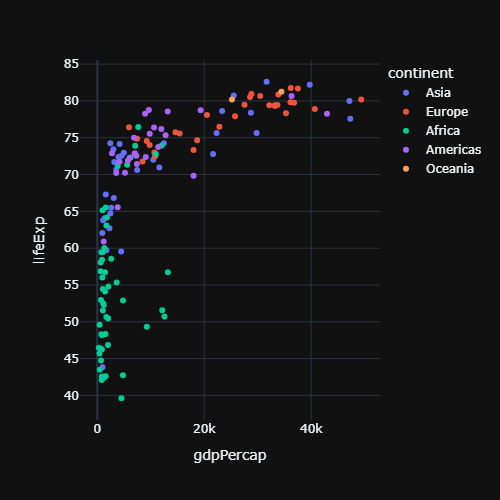
df = px.data.gapminder().query("year == 2007")

fig = px.scatter(df, x = "gdpPercap", y = "lifeExp", color = "continent")

fig.show()fig.write_html("chart.html")By default the file includes the whole plotly.js library (around 3.5 MB). Use include_plotlyjs = "cdn" to load it from the internet instead and get a much smaller file:
fig.write_html("chart.html", include_plotlyjs = "cdn")
Static images with write_image
Exporting to PNG, JPG, SVG or PDF requires the kaleido package (pip install kaleido). The format is deduced from the extension of the file.
fig.write_image("chart.png")
fig.write_image("chart.svg")
fig.write_image("chart.pdf")
Size and resolution
Set the size in pixels with width and height and increase the resolution with scale. For instance, scale = 2 doubles the number of pixels without changing the proportions of the texts.
fig.write_image("chart.png", width = 1200, height = 800, scale = 2)Toolbar and download button
The toolbar (modebar) displayed over the chart includes a button to download it as PNG. Customize the download options or hide the toolbar with the config argument of show or write_html.
config = {"toImageButtonOptions": {"format": "svg", "filename": "my_chart",
                                  "width": 1200, "height": 800},
          "displaylogo": False,
          "modeBarButtonsToRemove": ["lasso2d", "select2d"]}

fig.show(config = config)
fig.write_html("chart.html", config = config)
Use config = {"displayModeBar": False} to hide the toolbar completely. To set the size of the figure before exporting it see the plotly themes and layout tutorial.