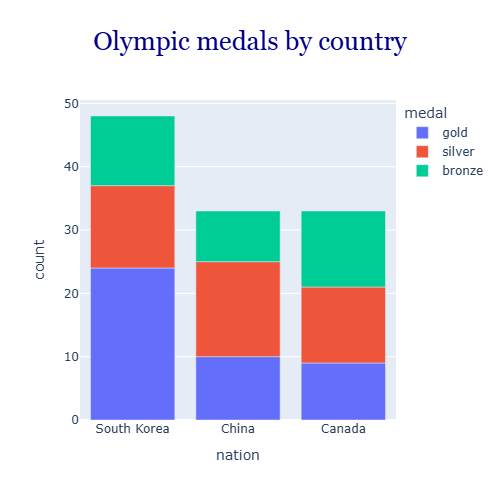
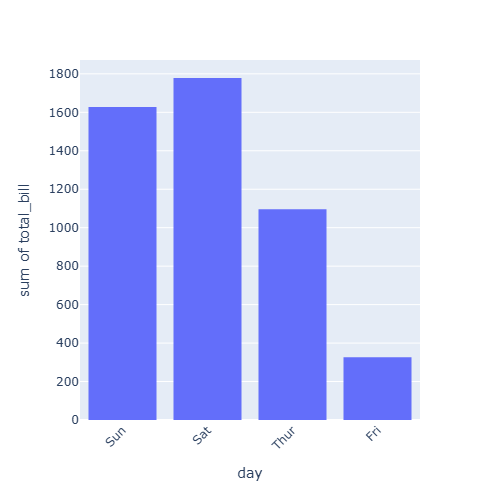
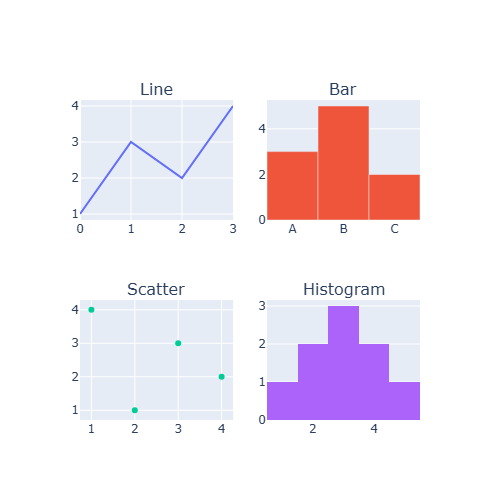
Plotly templates define the default appearance of the charts: background, grid, fonts and colors. On top of the template, update_layout allows changing the background colors, the fonts, the size and the margins of each figure.
Templates
Choose a template with the template argument. The built-in templates are "plotly" (default), "plotly_white", "plotly_dark", "ggplot2", "seaborn", "simple_white", "presentation" and "none".
import plotly.express as px

df = px.data.gapminder().query("year == 2007")

fig = px.scatter(df, x = "gdpPercap", y = "lifeExp", color = "continent",
                 template = "plotly_white")

fig.show()
Dark theme
import plotly.express as px

df = px.data.gapminder().query("year == 2007")

fig = px.scatter(df, x = "gdpPercap", y = "lifeExp", color = "continent",
                 template = "plotly_dark")

fig.show()
Default template
To use the same template for all the charts set it as default with plotly.io.
import plotly.io as pio

pio.templates.default = "simple_white"
Background color
plot_bgcolor changes the color of the plotting area and paper_bgcolor the color of the rest of the figure.
import plotly.express as px

df = px.data.gapminder().query("year == 2007")

fig = px.scatter(df, x = "gdpPercap", y = "lifeExp")

fig.update_layout(plot_bgcolor = "white",
                  paper_bgcolor = "aliceblue")
fig.update_xaxes(gridcolor = "lightgray")
fig.update_yaxes(gridcolor = "lightgray")

fig.show()
Global font
The font property of the layout sets the default font for all the texts of the figure.
import plotly.express as px

df = px.data.gapminder().query("year == 2007")

fig = px.scatter(df, x = "gdpPercap", y = "lifeExp", title = "Life expectancy")

fig.update_layout(font = dict(family = "Courier New", size = 14, color = "darkslategray"))

fig.show()
Figure size and margins
Plotly charts adapt to the width of the container. Set a fixed size in pixels with width and height and reduce the white space around the plot with margin.
import plotly.express as px

df = px.data.gapminder().query("year == 2007")

fig = px.scatter(df, x = "gdpPercap", y = "lifeExp")

fig.update_layout(width = 800, height = 500,
                  margin = dict(l = 20, r = 20, t = 40, b = 20))

fig.show()
See also the plotly color scales to change the colors of the data and exporting plotly charts to save them with a specific size.