Annotations are texts placed at specific coordinates of a chart, with or without an arrow. Shapes are lines, rectangles and circles drawn over the data. Both are added with fig.add_* methods.
Text annotations with add_annotation
Specify the coordinates with x and y and the text with text. By default an arrow points to the coordinates; use showarrow = False to display only the text.
import plotly.express as px

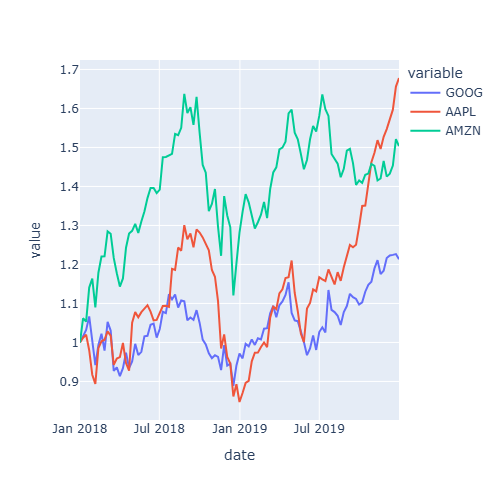
df = px.data.stocks()

fig = px.line(df, x = "date", y = "GOOG")
top = df.loc[df["GOOG"].idxmax()]

fig.add_annotation(x = top["date"], y = top["GOOG"],
                   text = "Maximum", showarrow = True, arrowhead = 2)

fig.show()
Annotation style
Customize the text with font, add a box with bgcolor and bordercolor and move the text with respect to the arrow with ax and ay (in pixels).
import plotly.express as px

df = px.data.stocks()

fig = px.line(df, x = "date", y = "GOOG")
top = df.loc[df["GOOG"].idxmax()]

fig.add_annotation(x = top["date"], y = top["GOOG"], text = "Maximum",
                   font = dict(size = 14, color = "white"),
                   bgcolor = "tomato", bordercolor = "black",
                   ax = -60, ay = -30)

fig.show()
Horizontal and vertical lines
add_hline and add_vline draw lines that span the whole plot, with an optional label through annotation_text.
import plotly.express as px

df = px.data.stocks()

fig = px.line(df, x = "date", y = "GOOG")

fig.add_hline(y = 1, line_dash = "dash", line_color = "red",
              annotation_text = "Baseline")
fig.add_vline(x = "2019-01-01", line_color = "gray")

fig.show()
Shaded regions
add_hrect and add_vrect shade a horizontal or a vertical band, for example to highlight a period of time.
import plotly.express as px

df = px.data.stocks()

fig = px.line(df, x = "date", y = "GOOG")

fig.add_vrect(x0 = "2018-10-01", x1 = "2019-01-01",
              fillcolor = "orange", opacity = 0.25, line_width = 0,
              annotation_text = "Q4 2018")

fig.show()
Other shapes with add_shape
add_shape draws lines, rectangles, circles and paths between two points (x0, y0) and (x1, y1).
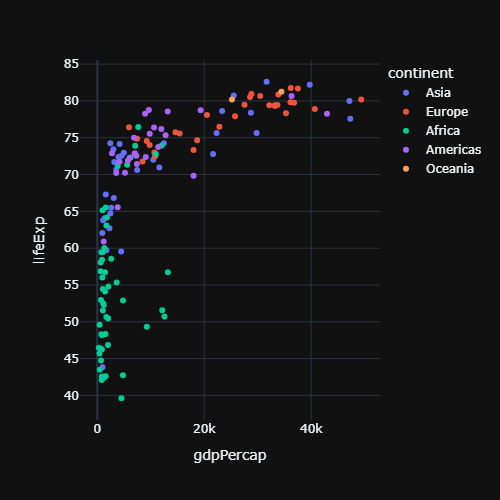
import plotly.express as px

df = px.data.gapminder().query("year == 2007")

fig = px.scatter(df, x = "gdpPercap", y = "lifeExp")

fig.add_shape(type = "circle", x0 = 35000, y0 = 77, x1 = 50000, y1 = 83,
              line_color = "red")

fig.show()
Texts can also be added to each data point with the text argument of Plotly Express. To customize the labels displayed on mouse hover see the hover labels in plotly tutorial.