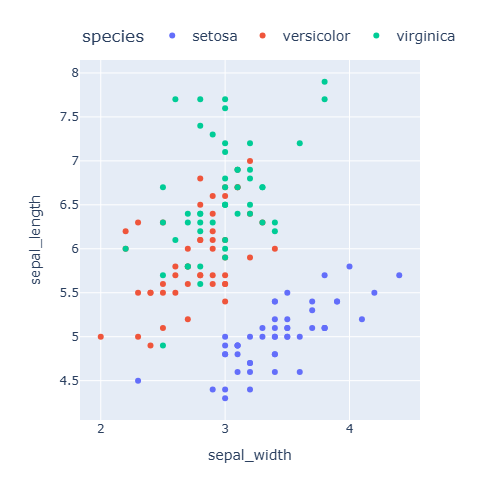
Hay dos formas de combinar varios gráficos en una figura de plotly: los argumentos facet_col y facet_row de Plotly Express, que dividen los datos por grupos, y la función make_subplots, que permite combinar cualquier tipo de gráfico.
Facetas con Plotly Express
facet_col crea un subplot para cada grupo de una variable en columnas diferentes y facet_row en filas diferentes. facet_col_wrap establece el número máximo de columnas.
import plotly.express as px

df = px.data.tips()

fig = px.scatter(df, x = "total_bill", y = "tip",
                 facet_col = "time")

fig.show()
Subplots con make_subplots
Crea la cuadrícula con make_subplots y agrega cada traza con add_trace, indicando su row y su col. Las trazas se crean con plotly.graph_objects.
import plotly.graph_objects as go
from plotly.subplots import make_subplots

fig = make_subplots(rows = 2, cols = 2,
                    subplot_titles = ["Líneas", "Barras", "Dispersión", "Histograma"])

fig.add_trace(go.Scatter(y = [1, 3, 2, 4], mode = "lines"), row = 1, col = 1)
fig.add_trace(go.Bar(x = ["A", "B", "C"], y = [3, 5, 2]), row = 1, col = 2)
fig.add_trace(go.Scatter(x = [1, 2, 3, 4], y = [4, 1, 3, 2], mode = "markers"), row = 2, col = 1)
fig.add_trace(go.Histogram(x = [1, 2, 2, 3, 3, 3, 4, 4, 5]), row = 2, col = 2)

fig.update_layout(showlegend = False)
fig.show()
Ejes compartidos y espaciado
shared_xaxes y shared_yaxes utilizan la misma escala en todos los subplots, mientras que horizontal_spacing y vertical_spacing controlan el espacio entre ellos (como fracción de la figura).
import plotly.graph_objects as go
from plotly.subplots import make_subplots

fig = make_subplots(rows = 2, cols = 1, shared_xaxes = True,
                    vertical_spacing = 0.05)

fig.add_trace(go.Scatter(y = [1, 3, 2, 4, 3]), row = 1, col = 1)
fig.add_trace(go.Bar(y = [5, 2, 4, 1, 3]), row = 2, col = 1)

fig.update_layout(showlegend = False)
fig.show()
Distintos tamaños
column_widths y row_heights establecen el tamaño relativo de cada columna y fila.
import plotly.graph_objects as go
from plotly.subplots import make_subplots

fig = make_subplots(rows = 1, cols = 2, column_widths = [0.7, 0.3])

fig.add_trace(go.Scatter(y = [1, 3, 2, 4, 3, 5]), row = 1, col = 1)
fig.add_trace(go.Box(y = [1, 3, 2, 4, 3, 5]), row = 1, col = 2)

fig.update_layout(showlegend = False)
fig.show()
Eje Y secundario
Para representar dos variables con escalas diferentes en el mismo gráfico activa un eje Y secundario con specs y agrega la traza con secondary_y = True.
import plotly.graph_objects as go
from plotly.subplots import make_subplots

fig = make_subplots(specs = [[{"secondary_y": True}]])

fig.add_trace(go.Bar(x = [1, 2, 3, 4], y = [10, 15, 12, 18], name = "Ventas"))
fig.add_trace(go.Scatter(x = [1, 2, 3, 4], y = [0.2, 0.25, 0.22, 0.3], name = "Margen"),
              secondary_y = True)

fig.update_yaxes(title_text = "Ventas", secondary_y = False)
fig.update_yaxes(title_text = "Margen", tickformat = ".0%", secondary_y = True)
fig.show()
Para cambiar el tamaño de toda la figura consulta el tutorial sobre los temas y el layout en plotly.