Data simulation
The data of the following block of code will be used in the examples below. On the right there is a table where you can see the data which will be used in this tutorial.
import numpy as np
import seaborn as sns
import random

# Data simulation
rng = np.random.RandomState(0)
variable = rng.normal(0, 1, size = 400)
random.seed(0)
group = random.choices(["G1", "G2", "G3"], k = 400)
group2 = random.choices(["A", "B"], k = 400)
df = {'variable': variable, 'group': group, 'group2': group2}
Bee swarm plot in seaborn with swarmplot
The swarmplot function allows creating a bee swarm plot or swarm plot in Python when using seaborn. Note that you can pass a variable or a variable of a data frame, as shown below.
import seaborn as sns

# Swarm plot
sns.swarmplot(x = variable)

# Equivalent to:
sns.swarmplot(x = "variable", data = df)
Vertical swarm plot
If you want to rotate your plot and create a vertical visualization you can input your variable to the y argument of the function, instead of x.
import seaborn as sns

# Swarm plot
sns.swarmplot(y = variable)
Size of the points
The default size of the points of the plot is 5. However, the size argument allows choosing the size you desire based on your data.
import seaborn as sns

# Swarm plot
sns.swarmplot(y = variable,
              size = 4)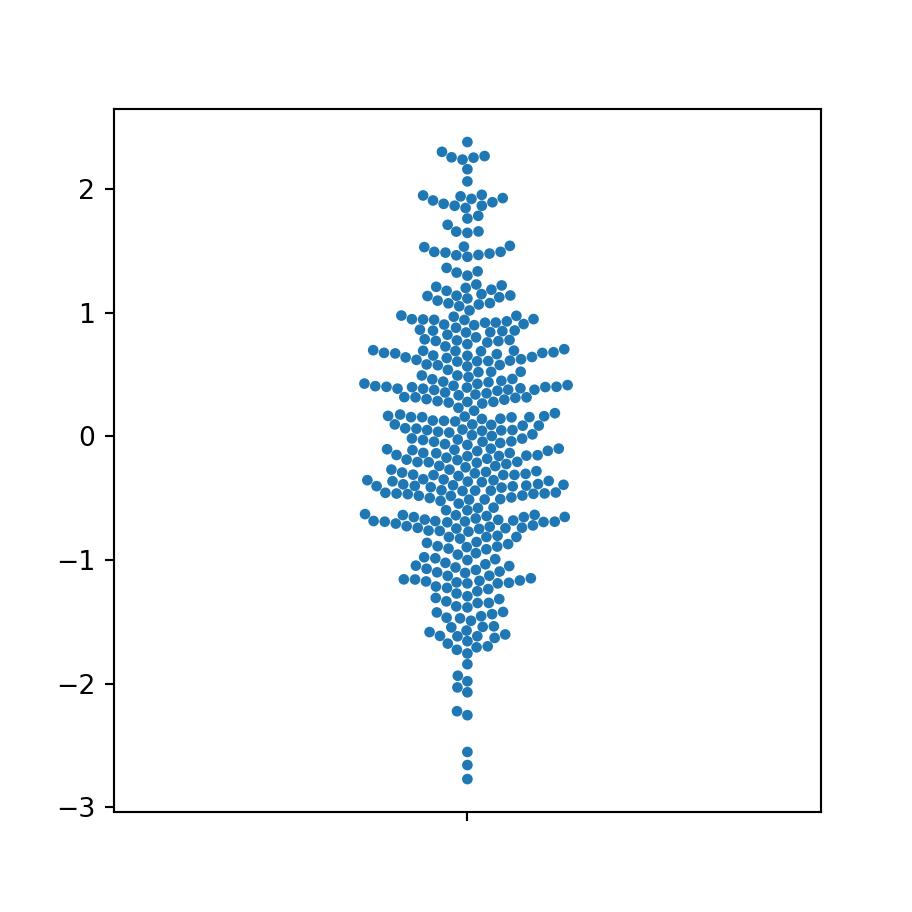
Fill color customization
By default, the points of the seaborn swarm plot will be blue, but you can customize its color setting a new color with the color argument of the swarmplot function.
import seaborn as sns

# Swarm plot
sns.swarmplot(y = variable,
              color = "green")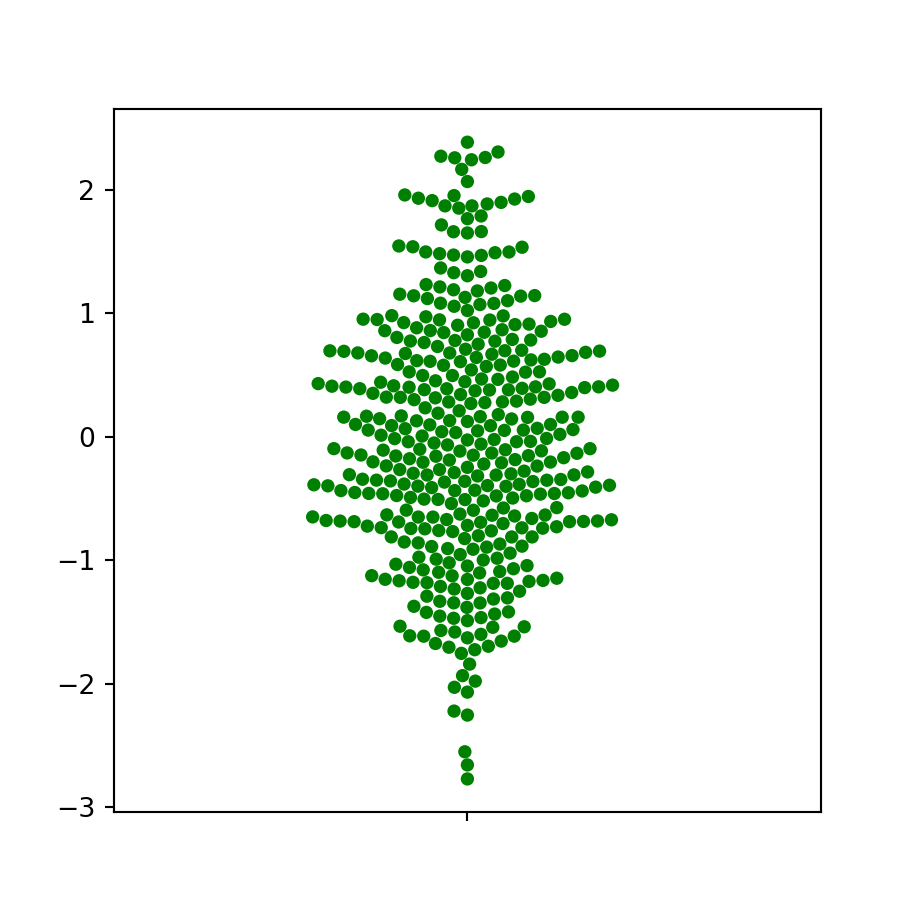
Border width and color of the points
In addition, it is possible to customize the width (which defaults to 0) and the color of the borders of the points with linewidth and edgecolor, respectively.
import seaborn as sns

# Swarm plot
sns.swarmplot(y = variable,
              edgecolor = "red",
              linewidth = 0.5)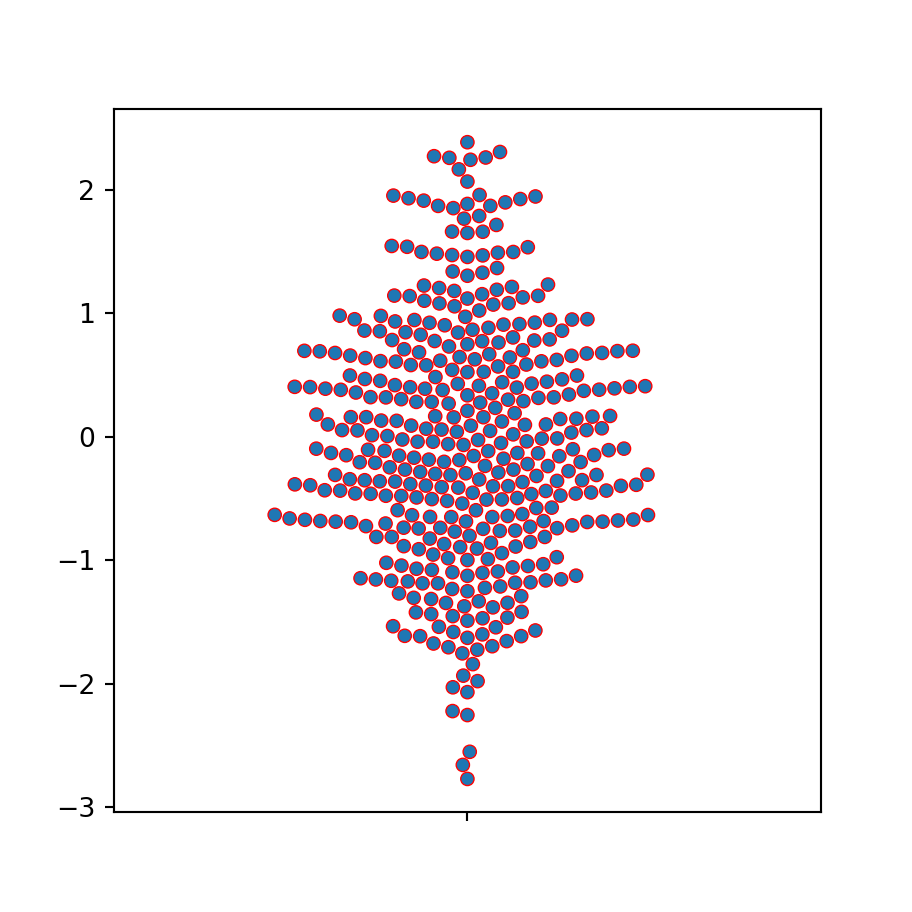
Swarm plot by group in seaborn

If you have a categorical variable representing groups you can pass both the numerical and the categorical variable to the function to create a swarm plot by group in Python with seaborn.
import seaborn as sns

# Swarm plot
sns.swarmplot(x = group, y = variable)

# Equivalent to:
sns.swarmplot(x = "group", y = "variable", data = df)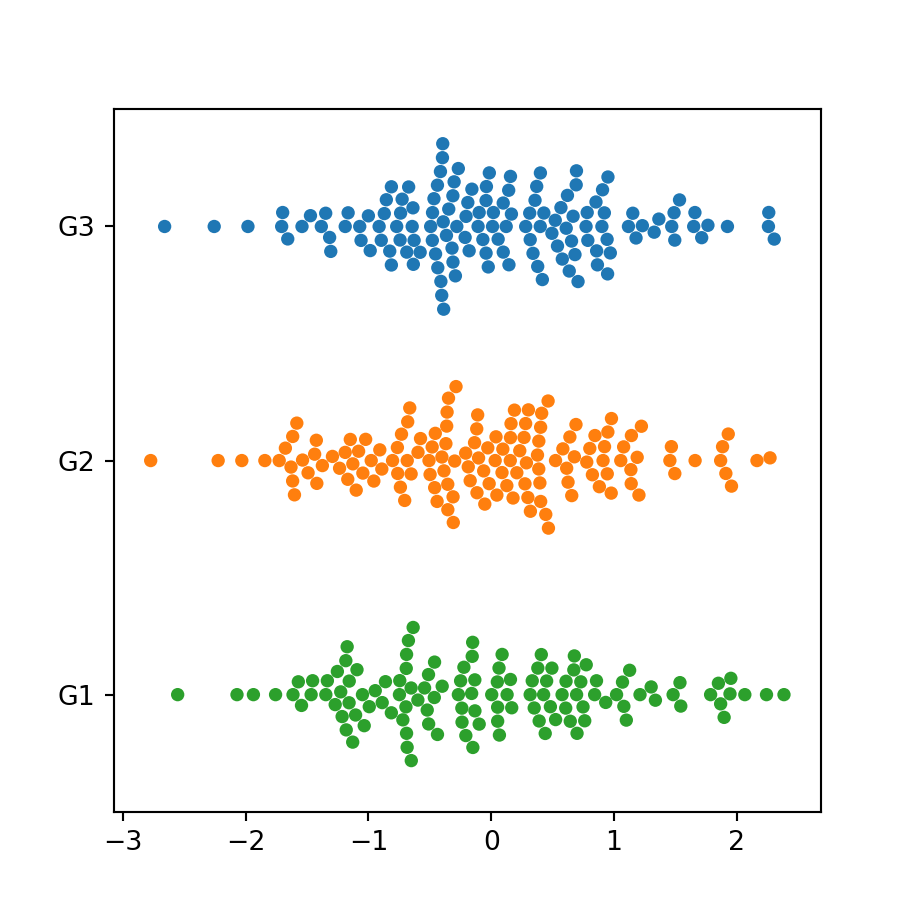
Orientation
Note that if you change the order of the variables you can create an horizontal swarm plot by group.
import seaborn as sns

# Swarm plot
sns.swarmplot(y = group, x = variable)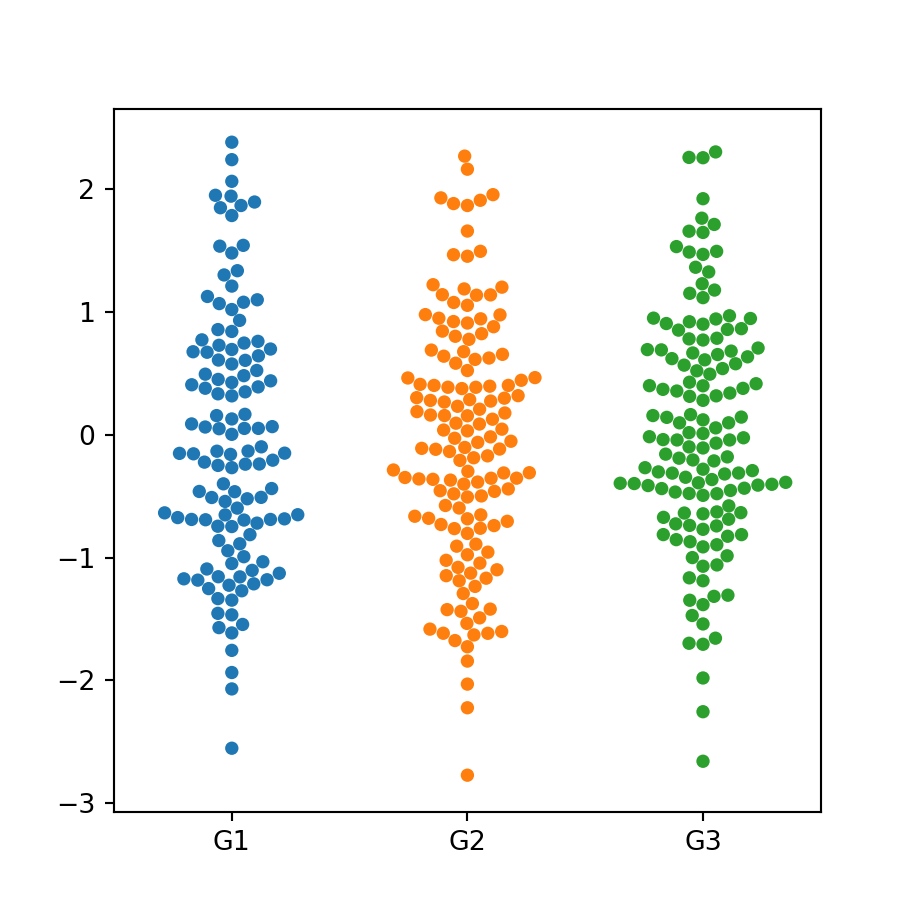
Custom order
You might have noticed that the order of the groups on the previous plot was G3, G2, and G1, which is the order of appearance of the groups of the categorical variable (check it seeing the table of the first section). To modify the order you can use the order argument as follows.
import seaborn as sns

# Swarm plot
sns.swarmplot(x = group, y = variable,
              order = ["G1", "G2", "G3"])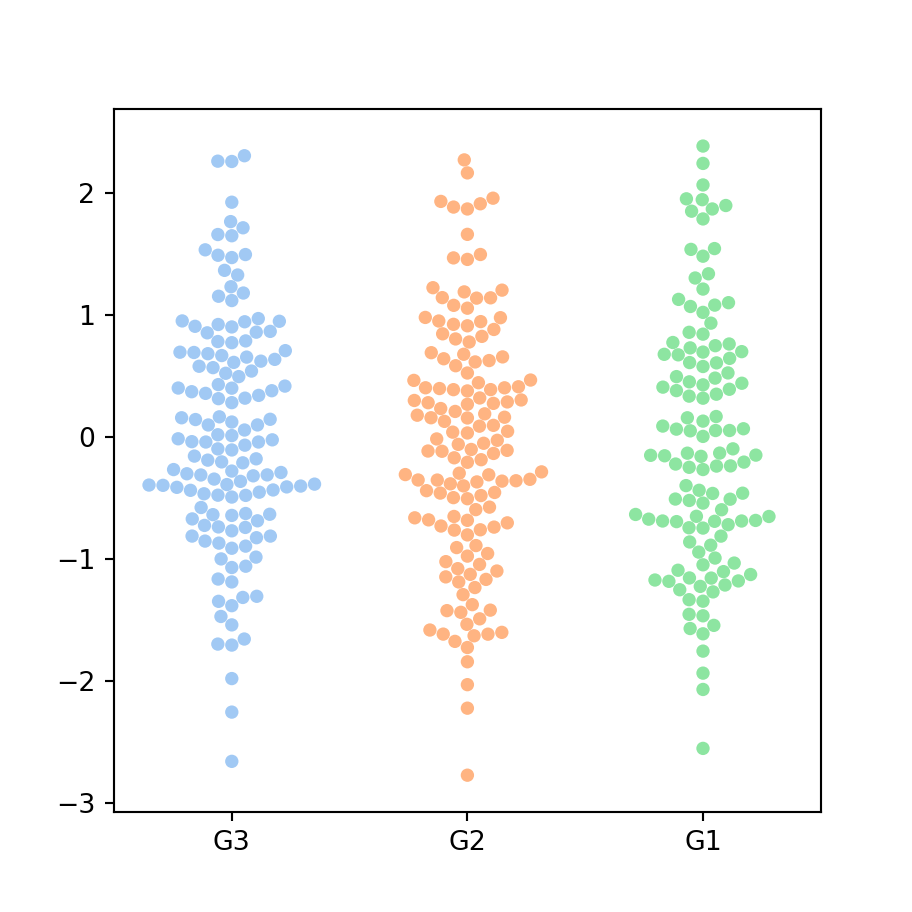
Color palette
The palette argument allows customizing the color palette of the plot. You can pass the name of a color palette or a dictionary with a color for each group.
import seaborn as sns

# Swarm plot
sns.swarmplot(x = group, y = variable,
              palette = "pastel")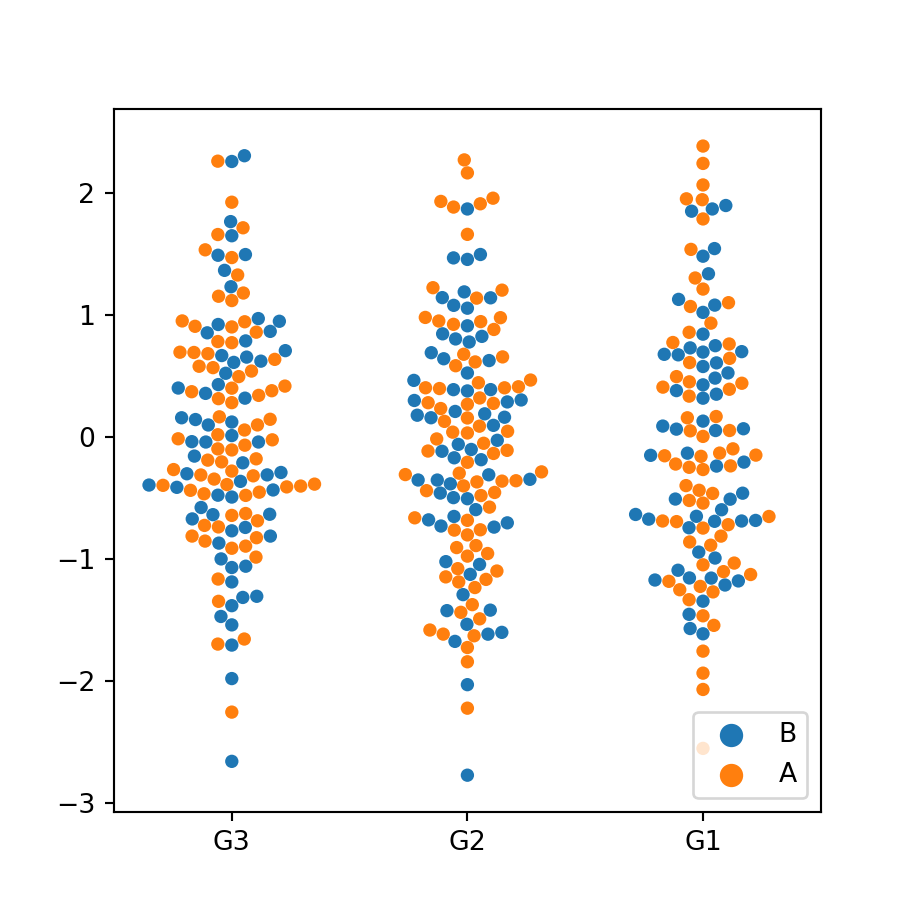
Color based on a second categorical variable
If your data set contains a second grouping variable you can pass it to the hue argument to colorize each group based on that subgroups.
import seaborn as sns

# Swarm plot
sns.swarmplot(x = group, y = variable,
              hue = group2)
Dodged swarm plot
In the previous scenario you can also set the argument dodge to True, so the data points will be separated based on the second group.
import seaborn as sns

# Swarm plot
sns.swarmplot(x = group, y = variable,
              hue = group2, dodge = True)


