How to change the size of a seaborn plot depends on the type of function you use. Axes-level functions (scatterplot, histplot, boxplot, heatmap…) draw on a matplotlib axes, so the size is set when creating the figure. Figure-level functions (relplot, displot, catplot, lmplot, pairplot, jointplot) create their own figure and use the height and aspect arguments instead.
Size of axes-level plots
Create the figure with plt.subplots(figsize = (width, height)), in inches, and pass the axes to the seaborn function with the ax argument.
import seaborn as sns
import matplotlib.pyplot as plt

penguins = sns.load_dataset("penguins")

fig, ax = plt.subplots(figsize = (4, 4), facecolor = "#F4F1EA")
sns.violinplot(data = penguins, x = "species", y = "body_mass_g", ax = ax)
ax.set_title("figsize = (4, 4)", fontsize = 16, family = "monospace")
# plt.show()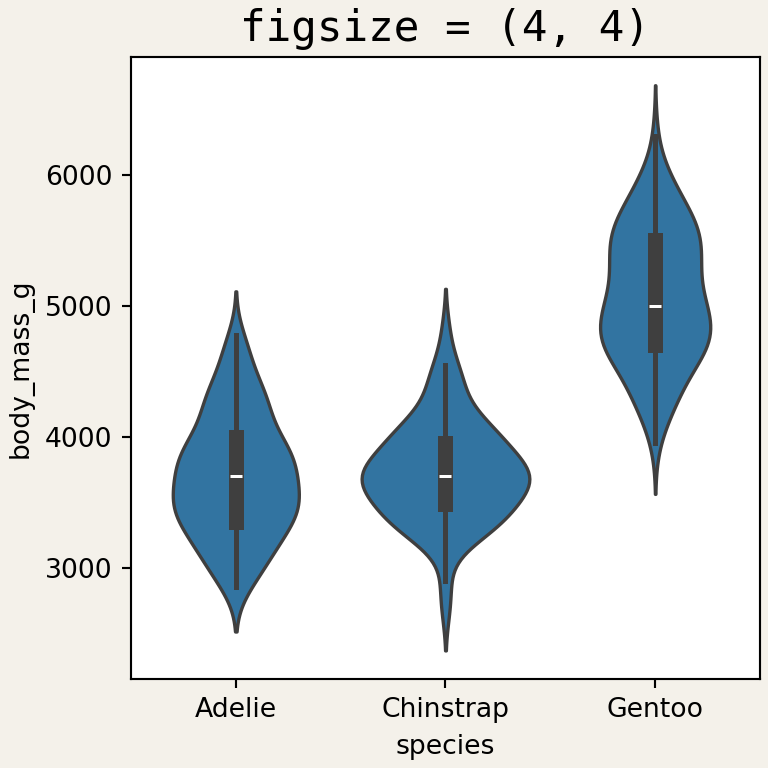
Using plt.figure
If you don’t need the axes object, calling plt.figure before the seaborn function also works.
import seaborn as sns
import matplotlib.pyplot as plt

tips = sns.load_dataset("tips")

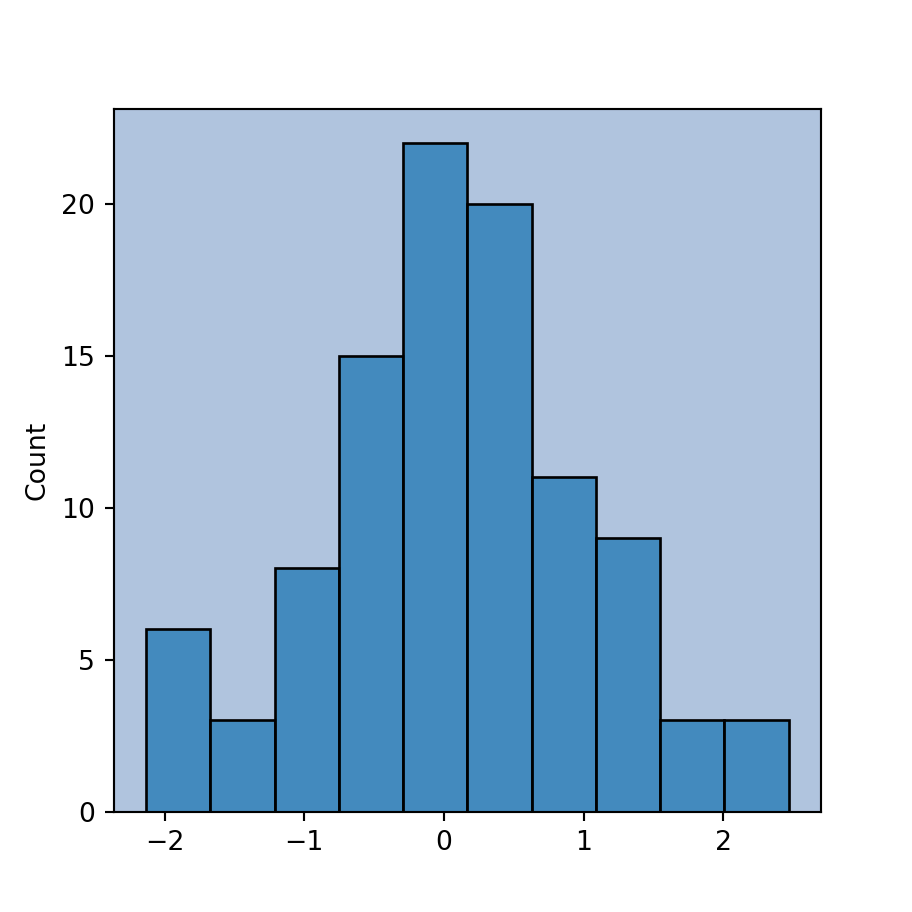
plt.figure(figsize = (10, 4))
sns.histplot(data = penguins, x = "body_mass_g")
# plt.show()
Size of figure-level plots
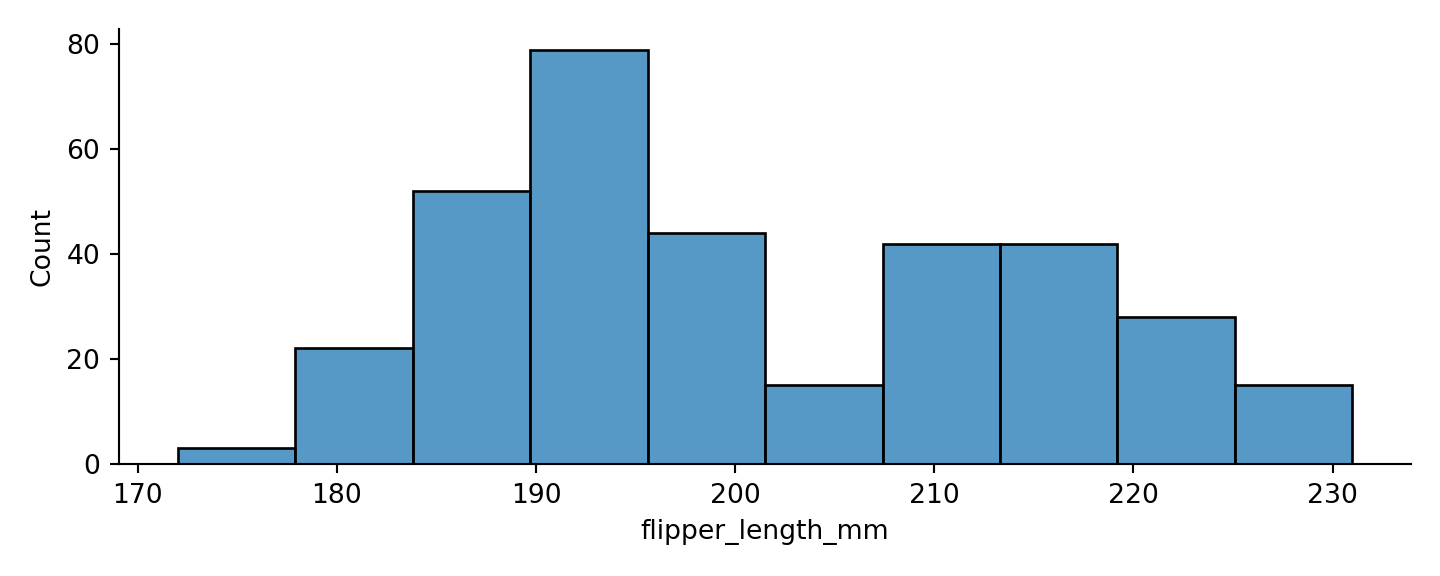
Figure-level functions ignore figsize. Use height to set the height of each subplot in inches and aspect to set its width as a proportion of the height (width = height x aspect).
import seaborn as sns
import matplotlib.pyplot as plt

penguins = sns.load_dataset("penguins")

sns.displot(data = penguins, x = "flipper_length_mm", height = 3, aspect = 2.5)
# plt.show()
Size of each facet
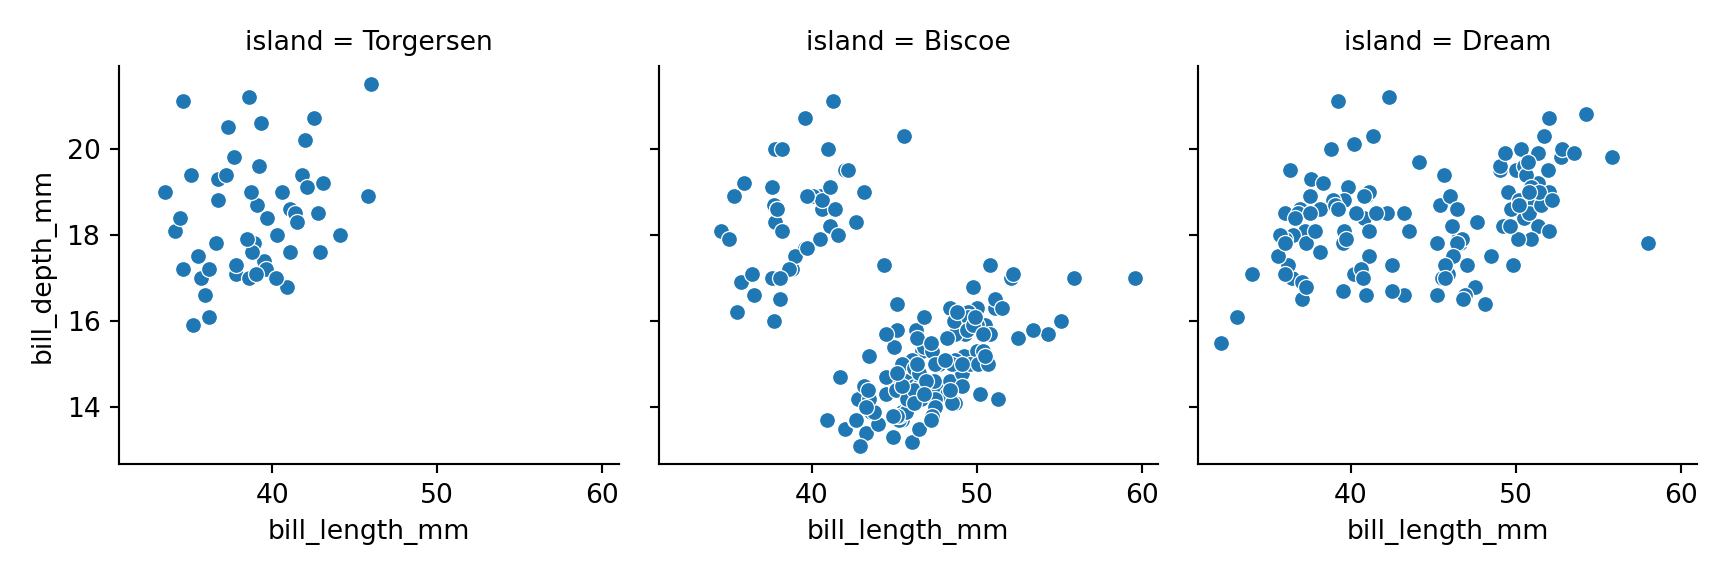
When the plot has several facets, height and aspect refer to each facet, so the figure grows with the number of subplots.
import seaborn as sns
import matplotlib.pyplot as plt

penguins = sns.load_dataset("penguins")

sns.relplot(data = penguins, x = "bill_length_mm", y = "bill_depth_mm", col = "island",
            height = 3, aspect = 1)
# plt.show()
Change the size after creating the plot
Figure-level functions return an object with a figure attribute, so you can also resize the whole figure with set_size_inches.
import seaborn as sns
import matplotlib.pyplot as plt

tips = sns.load_dataset("tips")

g = sns.relplot(data = penguins, x = "bill_length_mm", y = "bill_depth_mm")
g.figure.set_size_inches(8, 4)
# plt.show()
Change the default size
To change the default size of all axes-level plots set figure.figsize with the rc argument of sns.set_theme.
import seaborn as sns

sns.set_theme(rc = {"figure.figsize": (8, 5)})
The texts don’t change their size when the figure grows. To scale all the fonts at once use the font_scale argument of sns.set_theme, explained in the seaborn themes tutorial. You can also check how to change the figure size in matplotlib.