Adding texts in seaborn with the text function
If you want to add text to your visualizations made with seaborn you can use the text function as follows, specifying the coordinates and the text you would like to display inside the plot.
import seaborn as sns

# Plot
ax = sns.lineplot(x = [1, 2, 3, 4, 5],
                  y = [1, 4, 2, 5, 4])

# Text annotation at x = 2, y = 1.75
ax.text(2, 1.75, "Custom text")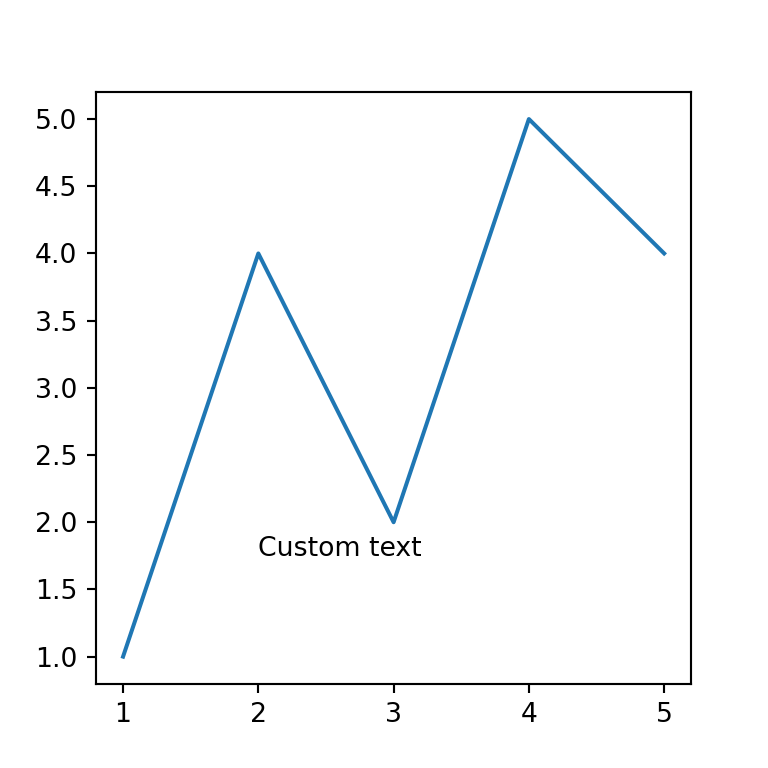
The text can be customized in several ways. It is possible to change the style, size, color and the horizontal and vertical alignment, among other arguments, as shown in the examples below.
import seaborn as sns

# Plot
ax = sns.lineplot(x = [1, 2, 3, 4, 5],
                  y = [1, 4, 2, 5, 4])

# Text annotation at x = 2, y = 1.75
ax.text(2, 1.75, "Custom text",
       fontsize = 12,          # Size
       fontstyle = "oblique",  # Style
       color = "red",          # Color
       ha = "center", # Horizontal alignment
va = "center") # Vertical alignment 
Text rotation
The rotation argument allows changing the angle of the text.
import seaborn as sns

# Plot
ax = sns.lineplot(x = [1, 2, 3, 4, 5],
                  y = [1, 4, 2, 5, 4])

# Text annotation at x = 2, y = 1.75
ax.text(2, 1.75, "Custom text",
rotation = -50) 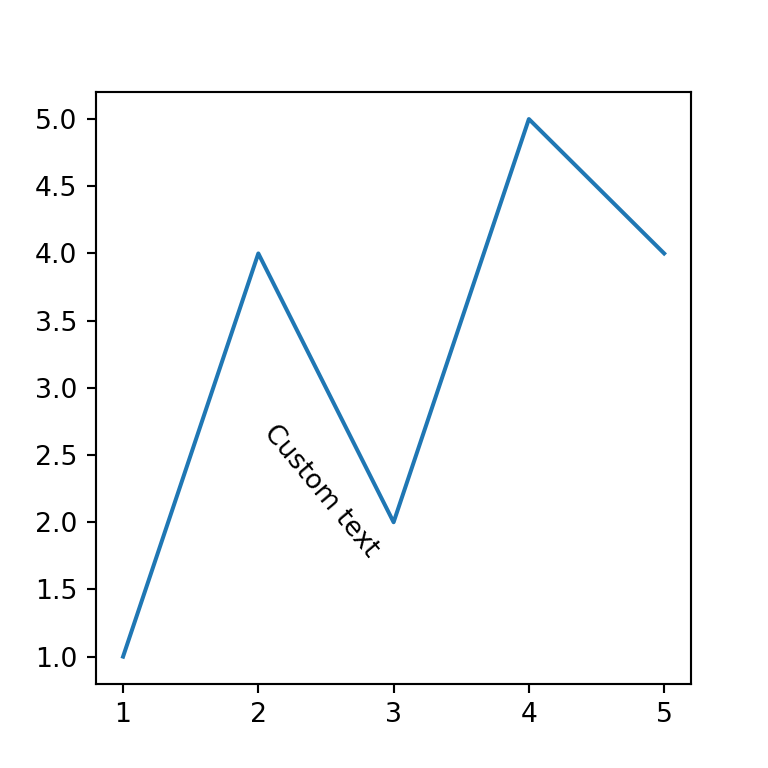
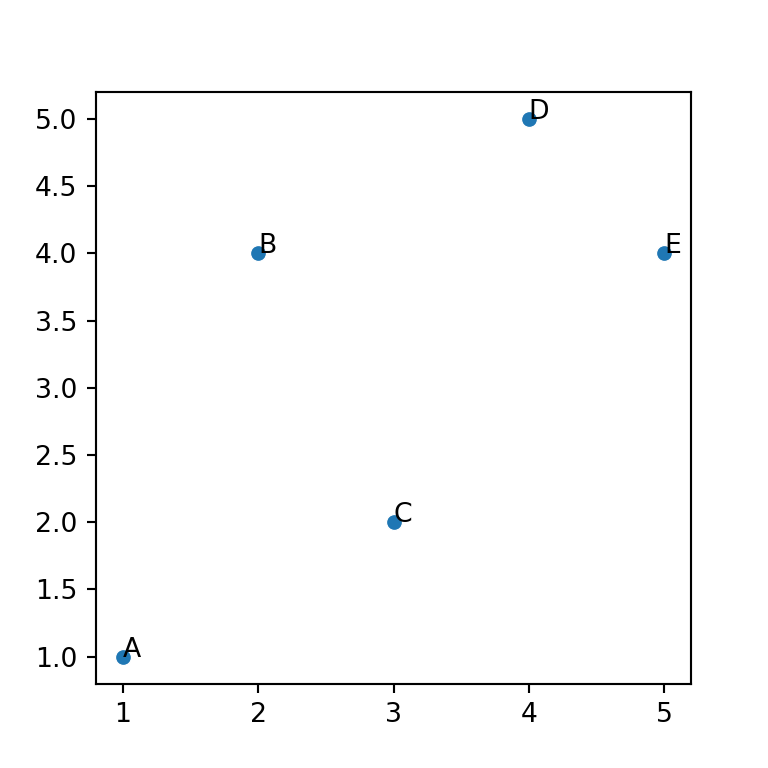
Labelling points
Note that you can also label points, or add several texts at once if needed, using a for loop.
import seaborn as sns

x = [1, 2, 3, 4, 5]
y = [1, 4, 2, 5, 4]
texts = ["A", "B", "C", "D", "E"]

# Plot
ax = sns.scatterplot(x = x, y = y)

for i, txt in enumerate(texts):
    ax.text(x[i], y[i], txt)