Vertical lines with axvline and vlines functions
If you want to add a vertical line to a plot made with seaborn you can use the axvline function and set where you want to display the vertical line with the x argument. The arguments ymin and ymax range from 0 to 1 and represent the starting point and the end point of the line.
import numpy as np
import seaborn as sns

# Data simulation
x = np.random.RandomState(1).normal(0, 1, size = 50)

ax = sns.kdeplot(x = x, fill = True, color = "limegreen", alpha = 0.1)
ax.axvline(x = 2,    # Line on x = 2
           ymin = 0, # Bottom of the plot
           ymax = 1) # Top of the plot
If you set other values to the ymin and ymax arguments you can create a segment. Recall that those values don’t represent the values of the Y-axis.
import numpy as np
import seaborn as sns

# Data simulation
x = np.random.RandomState(1).normal(0, 1, size = 50)

ax = sns.kdeplot(x = x, fill = True, color = "limegreen", alpha = 0.1)
ax.axvline(x = 2,      # Line on x = 2
           ymin = 0.2, # Bottom of the plot
           ymax = 0.8) # Top of the plot
In case you want to add several lines at once you can use the vlines function. The main advantage of this function is that you can set the minimum and maximum values according to the values to the Y-axis. Note that you can also create a single line with this function.
import numpy as np
import seaborn as sns

# Data simulation
x = np.random.RandomState(1).normal(0, 1, size = 50)

ax = sns.kdeplot(x = x, fill = True, color = "limegreen", alpha = 0.1)
ax.vlines(x = [-2, 0, 2], # Line on x = [-2, 0, 2]
          ymin = 0, # Starting point for all lines
          ymax = [0.05, 0.4, 0.05]) # End point for each line
Horizontal lines with axhline and hlines functions
Similarly, the axhline function allows adding horizontal lines to the seaborn plots, but now you need to set the value with the y argument and the minimum and maximum values from 0 to 1 with the xmin and xmax arguments.
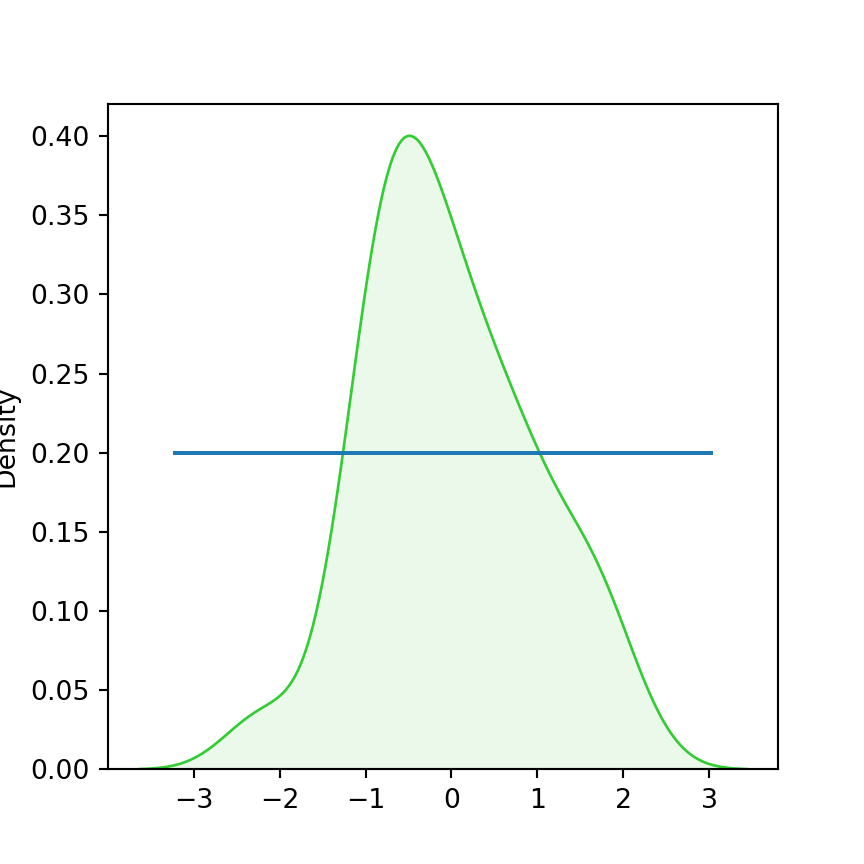
import numpy as np
import seaborn as sns

# Data simulation
x = np.random.RandomState(1).normal(0, 1, size = 50)

ax = sns.kdeplot(x = x, fill = True, color = "limegreen", alpha = 0.1)
ax.axhline(y = 0.2,    # Line on y = 0.2
           xmin = 0.1, # From the left
           xmax = 0.9) # To the right
In case you want to add several horizontal lines at once or if you prefer specifying the minimum and maximun values of the line based on the values of the X-axis you can use the hlines function, as shown below.
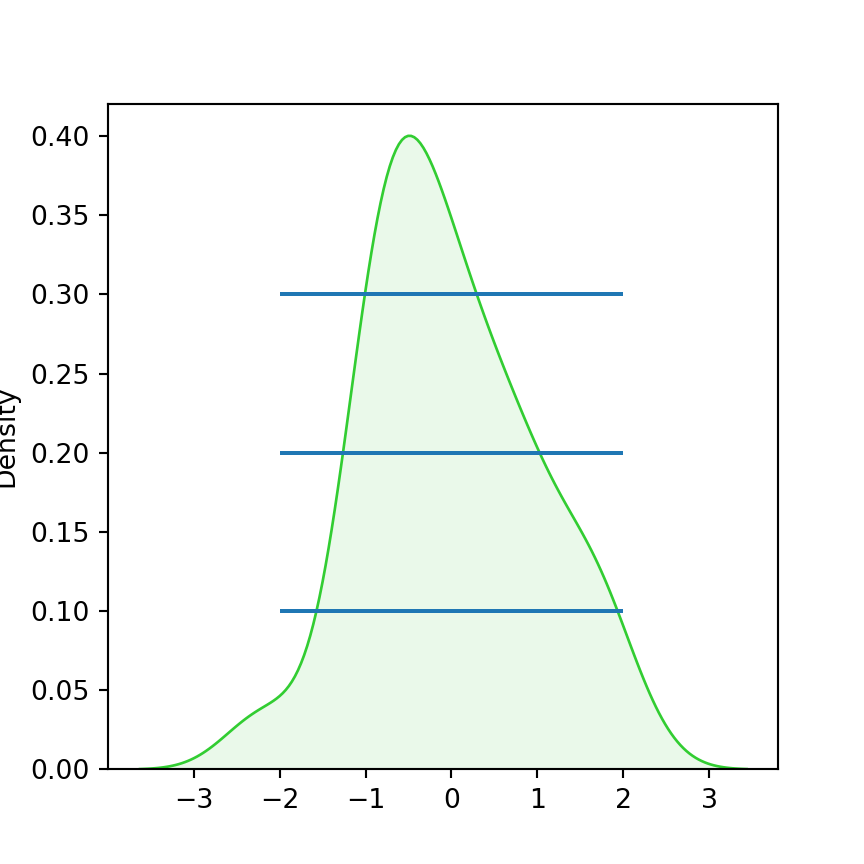
import numpy as np
import seaborn as sns

# Data simulation
x = np.random.RandomState(1).normal(0, 1, size = 50)

ax = sns.kdeplot(x = x, fill = True, color = "limegreen", alpha = 0.1)
ax.hlines(y = [0.1, 0.2, 0.3], # Y-axis values
          xmin = -2, # From x = -2
          xmax = 2)  # To x = 2
The main difference between the axvline, axhline and vlines, hlines functions is that the first pair of functions can only be used to add lines one by one and the specified minimum and maximum values must be between 0 and 1, while using the second pair functions you can add several lines at the same time and specify the exact points where you want to draw them.
Lines customization
The lines can be customized in several ways. Depending on the type of function you are using the names or the arguments are slightly different, as the style and color of the lines made with vlines and hlines can be customized with linestyles and colors, respectively, while the axhline and axvline functions provide the linestyle and color arguments.
import numpy as np
import seaborn as sns

# Data simulation
x = np.random.RandomState(1).normal(0, 1, size = 50)

ax = sns.kdeplot(x = x, fill = True, color = "limegreen", alpha = 0.1)
ax.vlines(x = [-2, 2], ymin = 0, ymax = 0.4,
          linestyles = ["dashed", "solid"], colors = ["red", "blue"])
ax.axhline(y = 0.2, xmin = 0, xmax = 1,
           color = "black", linestyle = "dashed")


