Adding titles in seaborn with the set_title function
The set_titles function allows adding titles to plots when using seaborn, as shown in the following example.
import seaborn as sns
df = sns.load_dataset("tips")

sns.scatterplot(x = "total_bill",
                y = "tip", data = df).set_title("Title")

# Equivalent to:
ax = sns.scatterplot(x = "total_bill",
                y = "tip", data = df)

ax.set_title("Title")
Size, weight and color
The fontdict argument of the function allows customizing the size, weight and color of the title, passing a dictionary with the desired values.
import seaborn as sns
df = sns.load_dataset("tips")

sns.scatterplot(x = "total_bill",
                y = "tip", data = df).set_title("Title",
                  fontdict = {'fontsize': 20,
                              'fontweight': 'bold',
                              'color': 'red'})
Horizontal adjustment
Note that the function also provides the loc argument, which defaults to "center" but you can also set it to "right" to move the title horizontally to the right or to "left", to move it to the left.
import seaborn as sns
df = sns.load_dataset("tips")

sns.scatterplot(x = "total_bill",
                y = "tip", data = df).set_title("Title",
loc = "right") 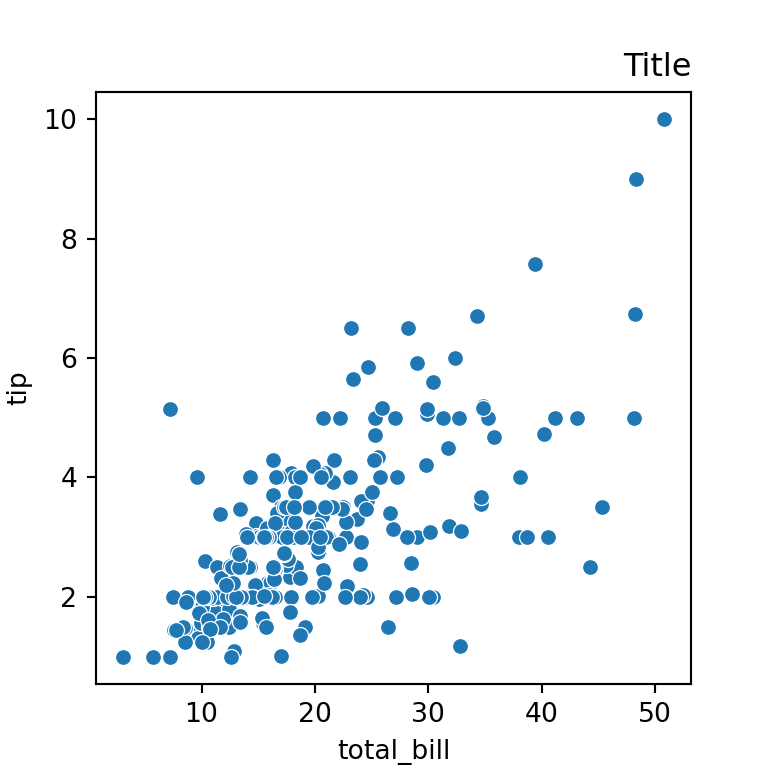
Using mathematical expressions
In addition, it is possible to use mathematical expressions in the title, as shown in the example below.
import seaborn as sns
df = sns.load_dataset("tips")

sns.scatterplot(x = "total_bill",
y = "tip", data = df).set_title(r'$\alpha = \delta$') 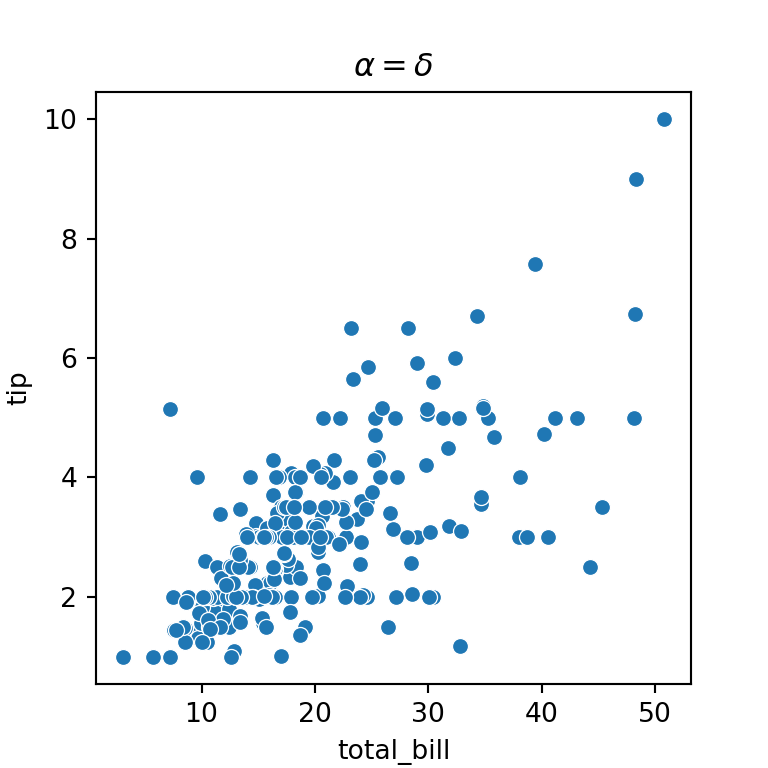
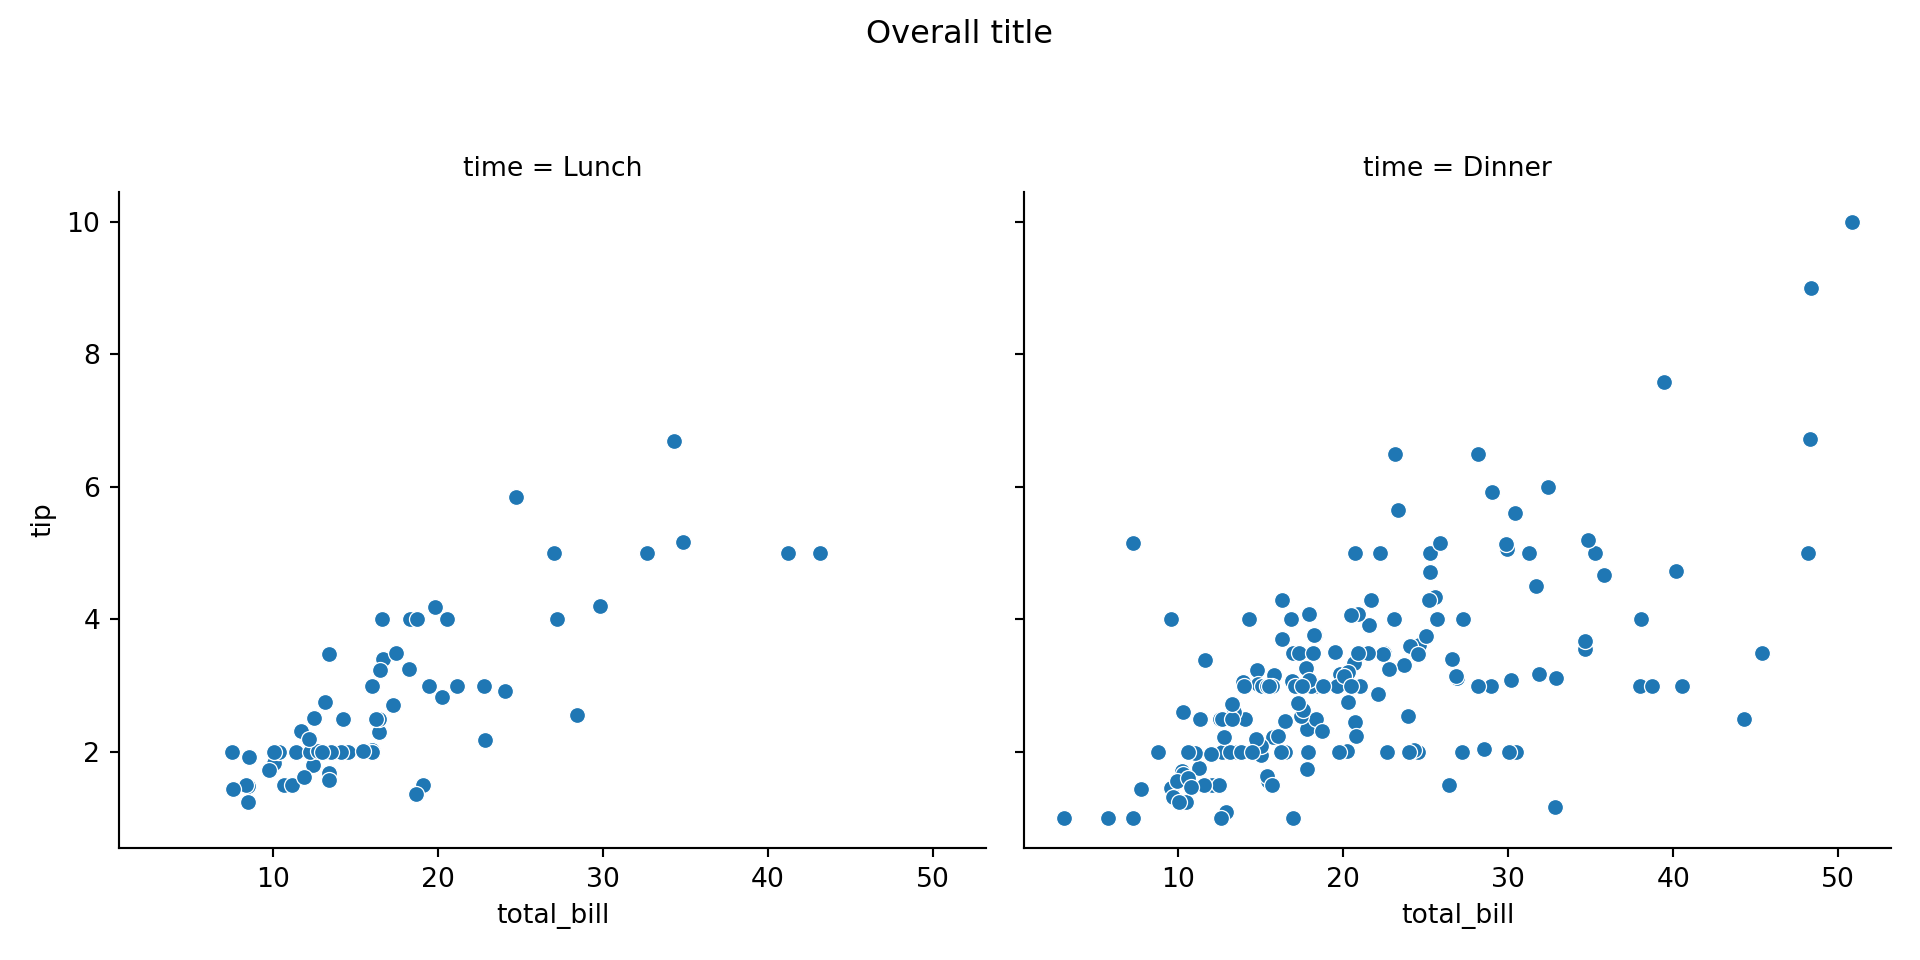
Adding an overall title with suptitle
If you are creating several plots over the same figure you can add an overall title for them. For that purpose you will need to use the suptitle function from the fig attribute of the plot.
import seaborn as sns
import matplotlib.pyplot as plt
df = sns.load_dataset("tips")

ax = sns.relplot(x = "total_bill", y = "tip", col = "time", data = df)

# Title for both plots
ax.fig.suptitle("Overall title")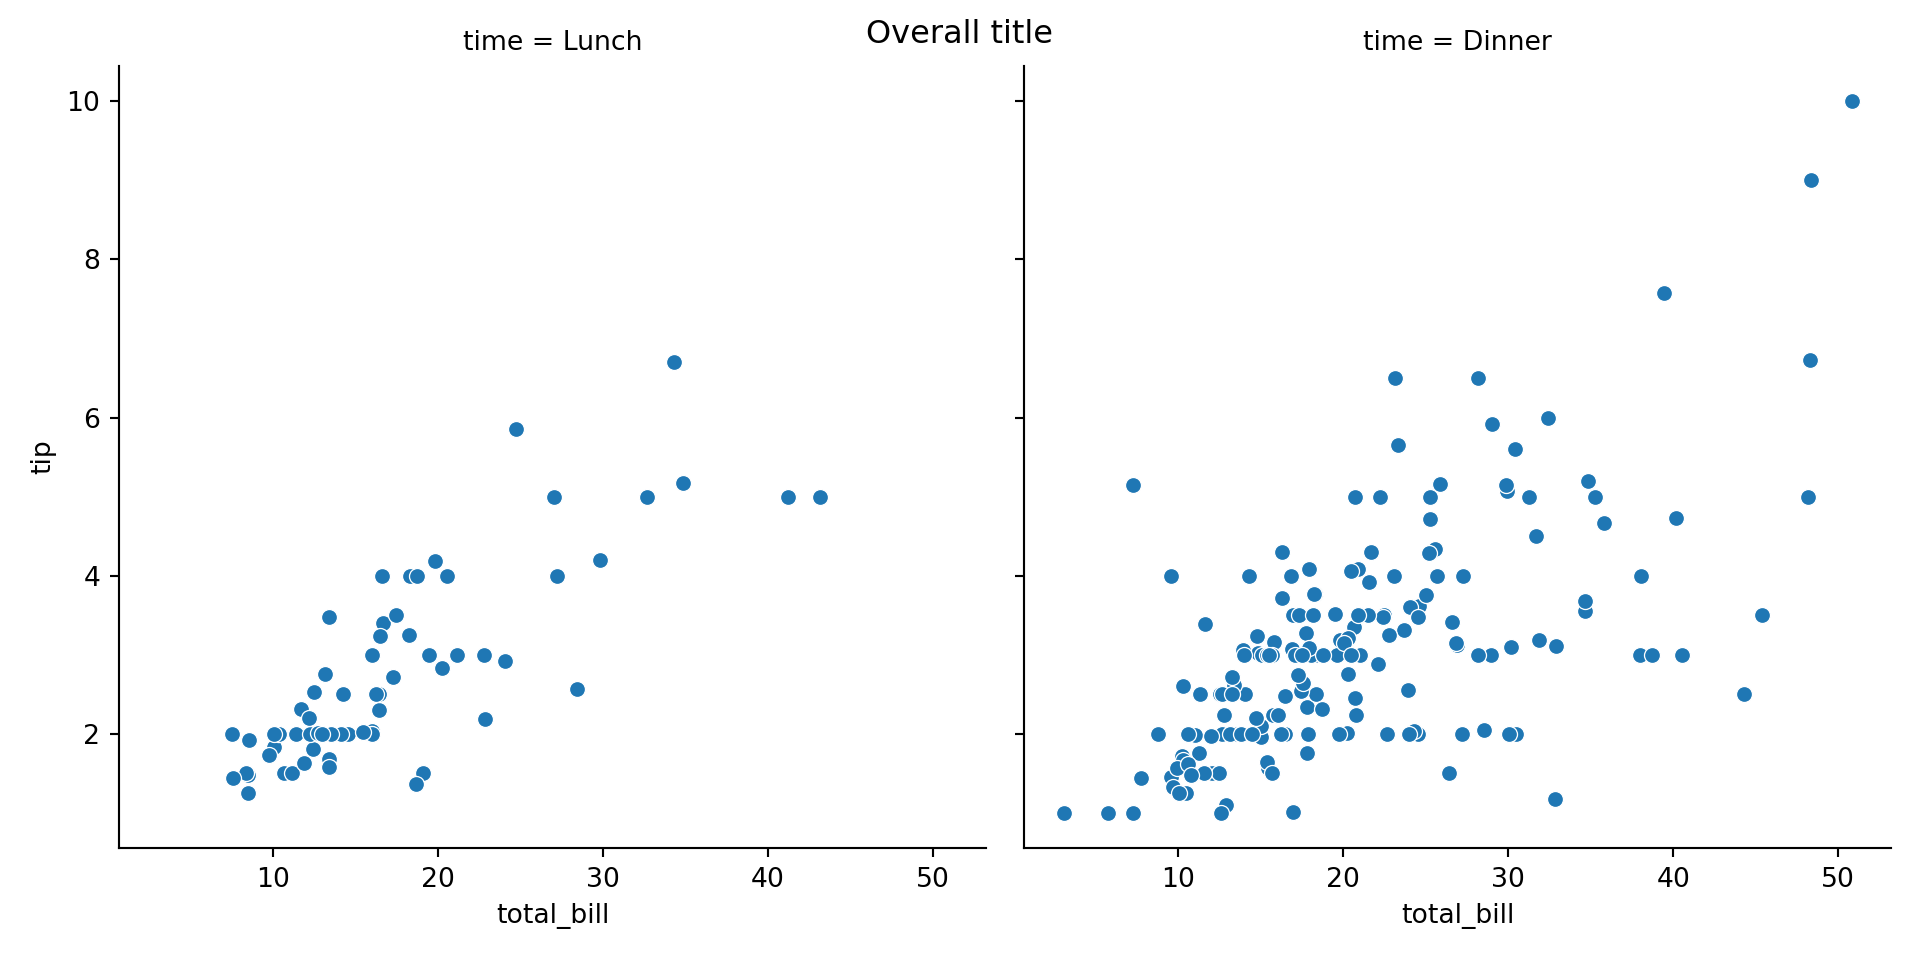
As you might have noticed, the title in the previous visualization was a bit low. If you want to adjust it you can use the subplots_adjust function as follows:
import seaborn as sns
import matplotlib.pyplot as plt
df = sns.load_dataset("tips")

ax = sns.relplot(x = "total_bill", y = "tip", col = "time", data = df)

# Adjustment
ax.fig.subplots_adjust(top = 0.8)

# Title for both plots
ax.fig.suptitle("Overall title")