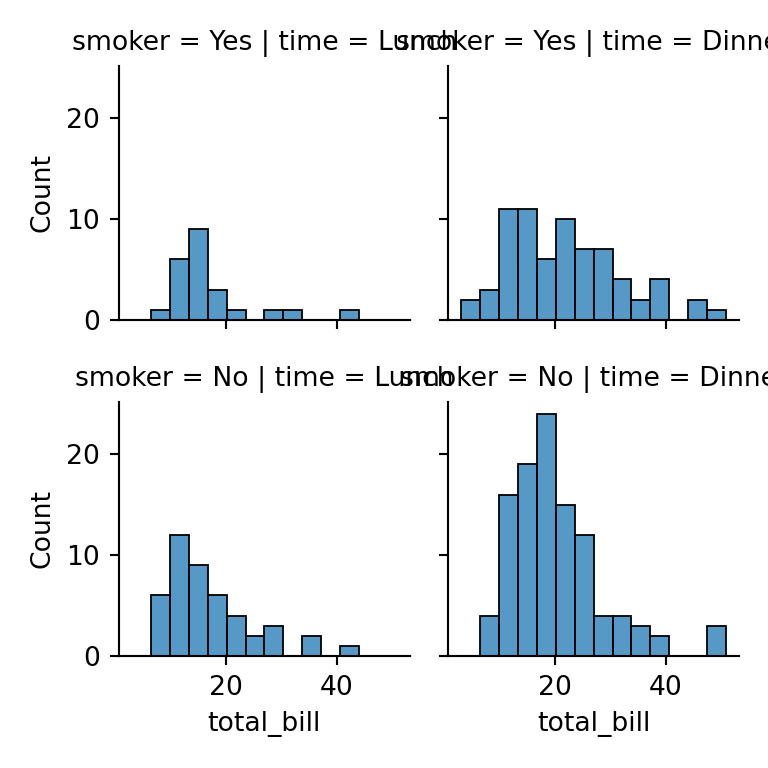
Seaborn functions return a matplotlib axes object (axes-level functions such as scatterplot or boxplot) or a grid of axes (figure-level functions such as relplot or displot). In both cases the axes can be customized with seaborn and matplotlib methods, as shown in this tutorial.
Axis labels
By default seaborn uses the names of the columns as axis labels. Change them with ax.set (or ax.set_xlabel and ax.set_ylabel).
import seaborn as sns
import matplotlib.pyplot as plt

iris = sns.load_dataset("iris")

ax = sns.scatterplot(data = iris, x = "sepal_length", y = "petal_length")
ax.set(xlabel = "Sepal length (cm)", ylabel = "Petal length (cm)")
# plt.show()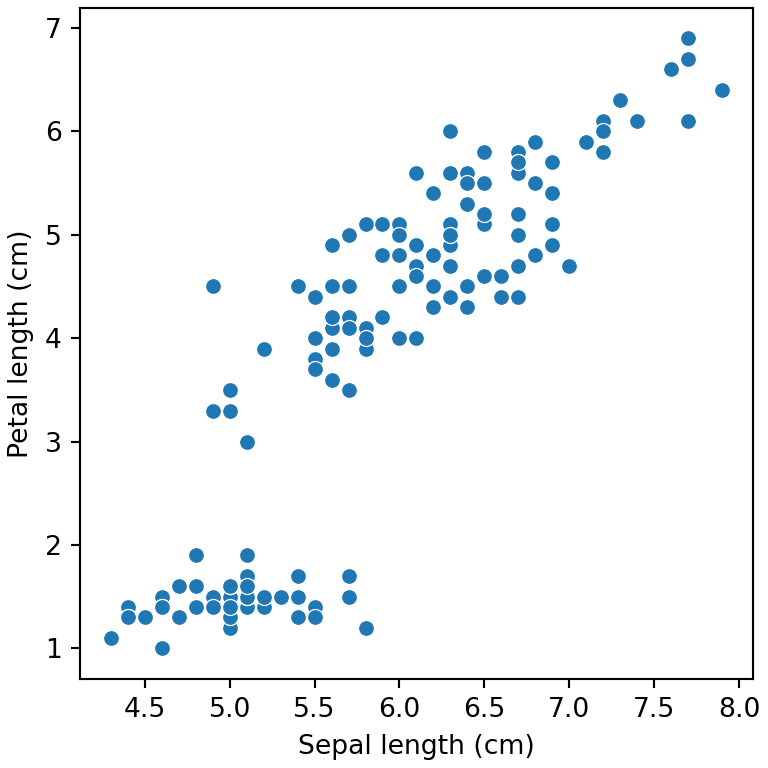
Labels in figure-level functions
Figure-level functions return a FacetGrid. Use its set_axis_labels method to change the labels of all the subplots at once.
import seaborn as sns
import matplotlib.pyplot as plt

iris = sns.load_dataset("iris")

g = sns.relplot(data = iris, x = "sepal_length", y = "petal_length", height = 4)
g.set_axis_labels("Sepal length (cm)", "Petal length (cm)")
# plt.show()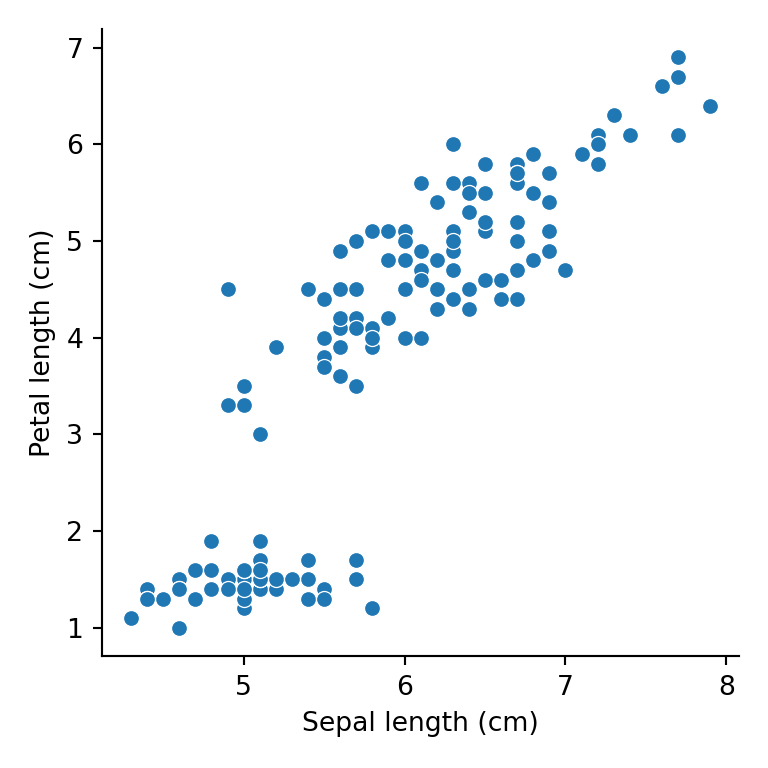
Axis limits
Set the limits of the axes with ax.set(xlim = ..., ylim = ...) or with set_xlim and set_ylim.
import seaborn as sns
import matplotlib.pyplot as plt

iris = sns.load_dataset("iris")

ax = sns.scatterplot(data = iris, x = "sepal_length", y = "petal_length")
ax.set(xlim = (4, 8), ylim = (0, 8))
# plt.show()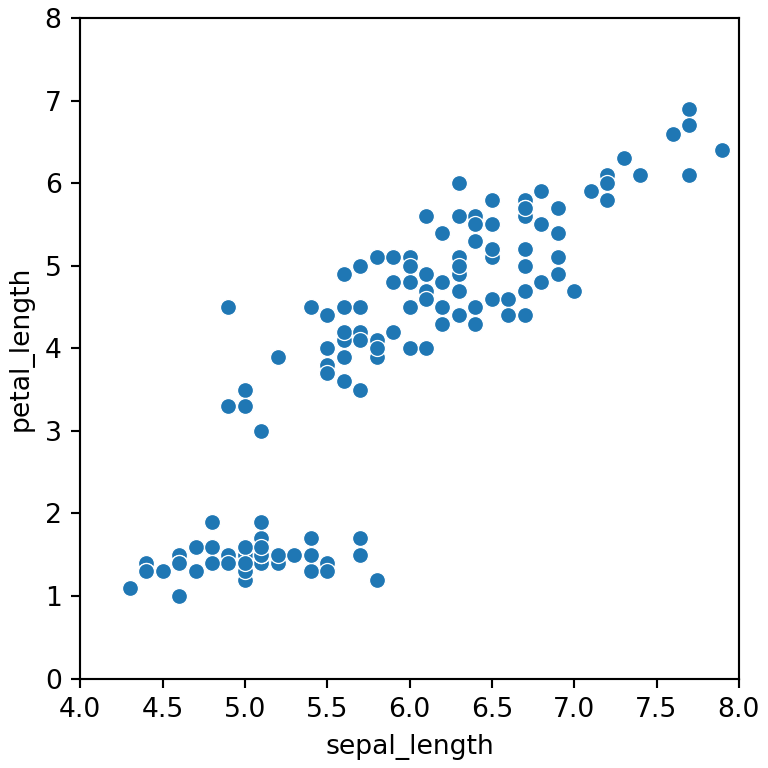
Rotate the tick labels
When the categories have long names the labels of the X axis overlap. Rotate them with tick_params or plt.xticks(rotation = 45). For figure-level functions use g.tick_params(axis = "x", rotation = 45).
import pandas as pd
import seaborn as sns
import matplotlib.pyplot as plt

df = pd.DataFrame({"country": ["United States", "United Kingdom", "Germany", "France", "Spain"],
                   "value": [32, 21, 25, 18, 15]})

ax = sns.barplot(data = df, x = "country", y = "value", color = "#4C72B0")
ax.tick_params(axis = "x", rotation = 45, labelsize = 12)
# plt.show()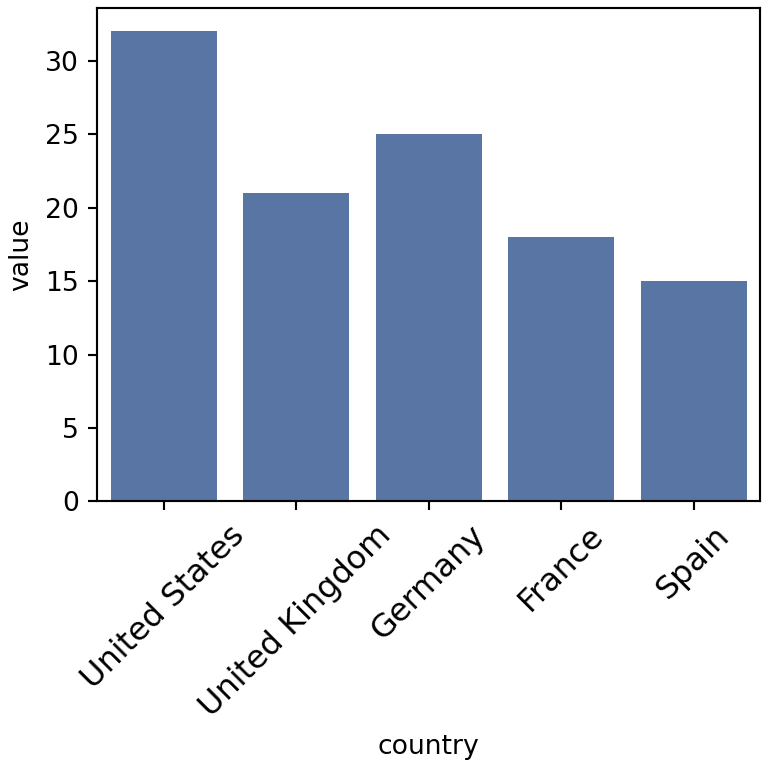
Horizontal plots
An alternative to rotating the labels is swapping the variables to create a horizontal plot, where long labels have much more space.
import pandas as pd
import seaborn as sns
import matplotlib.pyplot as plt

df = pd.DataFrame({"country": ["United States", "United Kingdom", "Germany", "France", "Spain"],
                   "value": [32, 21, 25, 18, 15]})

sns.barplot(data = df, x = "value", y = "country")
# plt.show()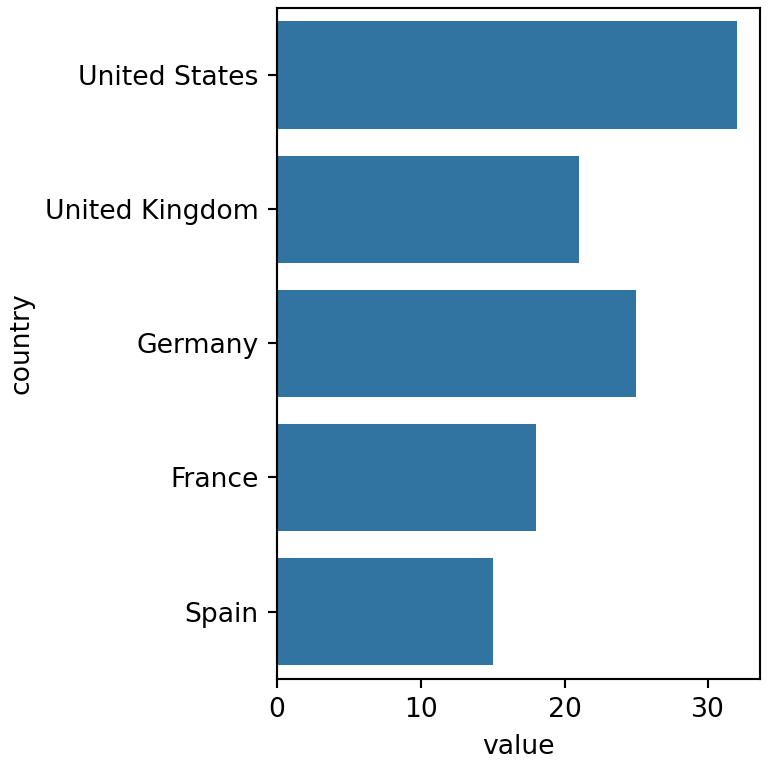
Ticks and tick format
Change the position of the ticks with set_xticks and set_yticks and format the numbers with the formatters of matplotlib.ticker, for example to show currency or percentages.
import seaborn as sns
import matplotlib.pyplot as plt
from matplotlib.ticker import StrMethodFormatter

diamonds = sns.load_dataset("diamonds")

ax = sns.histplot(data = diamonds, x = "price", binrange = (0, 10000))
ax.set_xticks([0, 2500, 5000, 7500, 10000])
ax.xaxis.set_major_formatter(StrMethodFormatter("${x:,.0f}"))
# plt.show()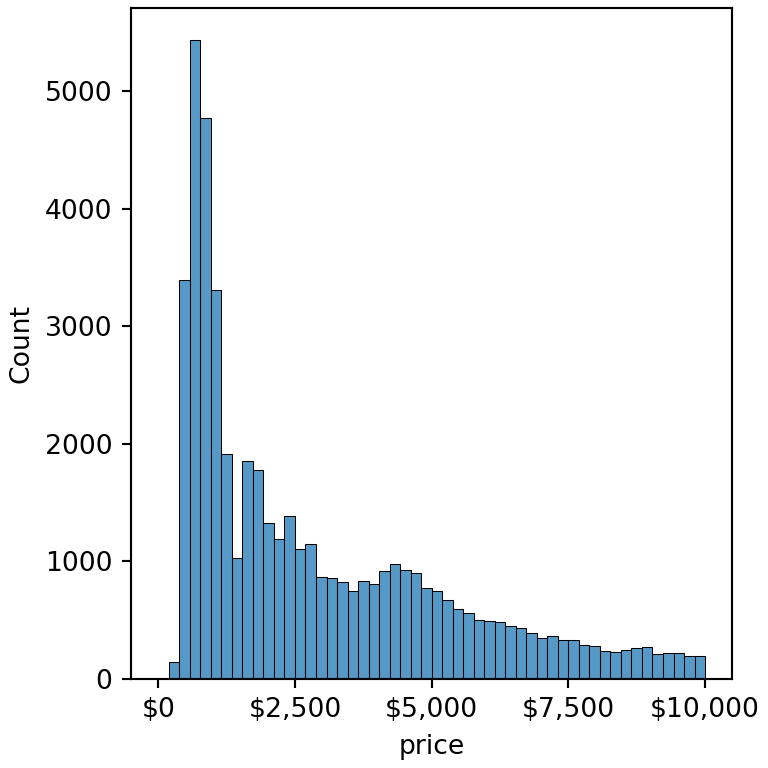
Logarithmic scale
Several seaborn functions, such as histplot, kdeplot or boxplot, provide a log_scale argument. For the rest use ax.set_xscale("log") or ax.set_yscale("log").
import seaborn as sns
import matplotlib.pyplot as plt

diamonds = sns.load_dataset("diamonds")

sns.histplot(data = diamonds, x = "price", log_scale = True)
# plt.show()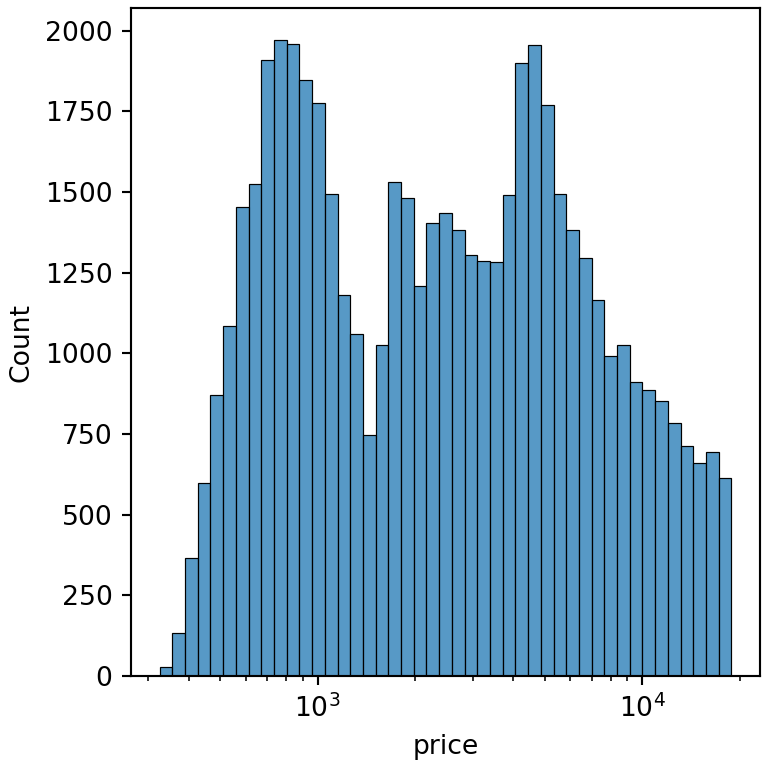
Remove the axis borders with despine
sns.despine removes the top and right spines. Use left = True or bottom = True to remove the other ones and offset to separate the axes from the data.
import seaborn as sns
import matplotlib.pyplot as plt

iris = sns.load_dataset("iris")

sns.boxplot(data = iris, x = "species", y = "sepal_width")
sns.despine(offset = 10, trim = True)
# plt.show()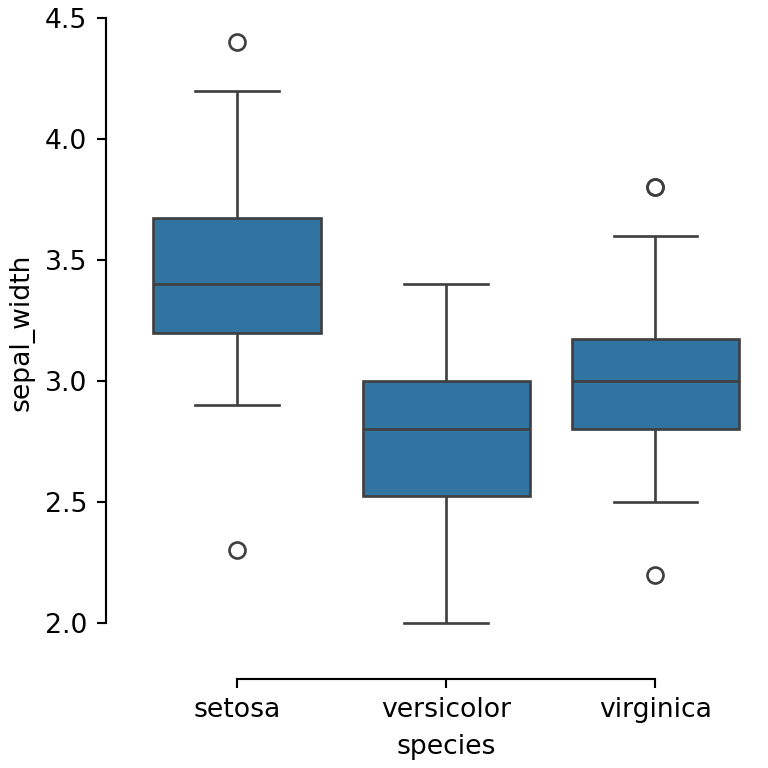
Figure-level functions call despine automatically. See also how to customize the grid, the titles or the theme of seaborn plots.