Faceting consists of splitting the data by the values of one or two categorical variables and drawing one subplot for each group. In seaborn, figure-level functions (relplot, displot, catplot and lmplot) support faceting directly through the col and row arguments.
Facets with col and row
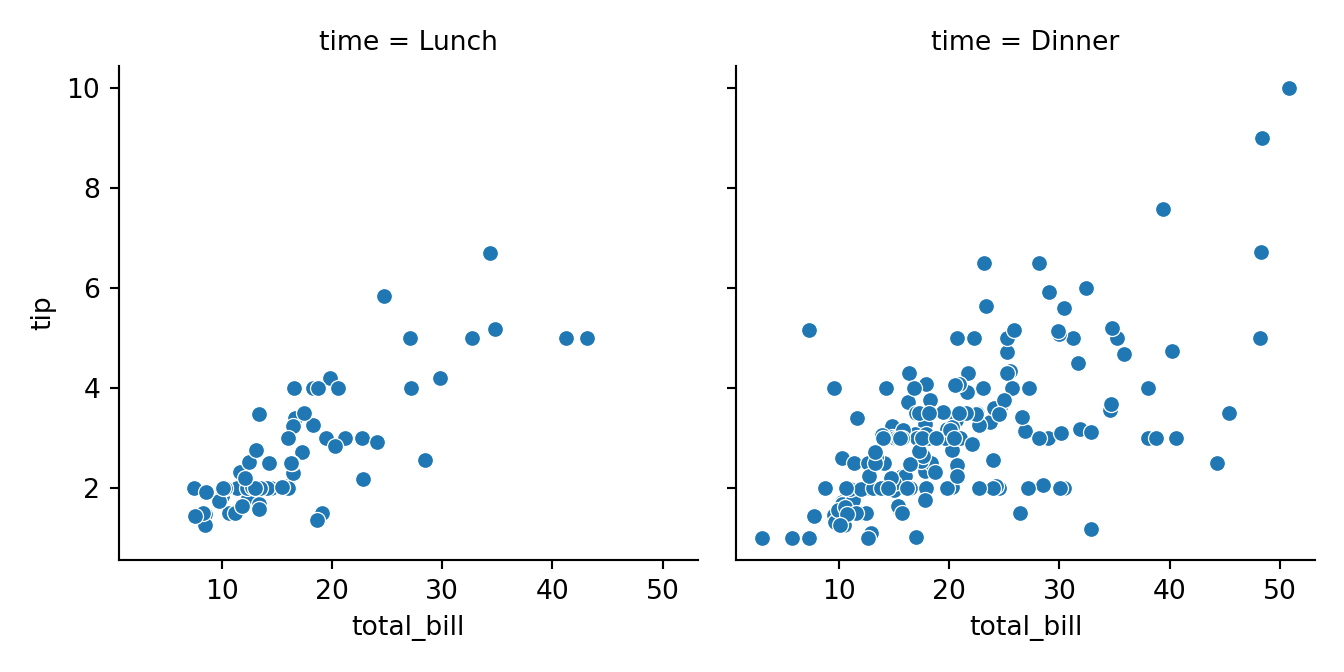
Pass the name of a column to col to create one subplot per group in different columns, or to row to place them in different rows.
import seaborn as sns
import matplotlib.pyplot as plt

tips = sns.load_dataset("tips")

sns.relplot(data = tips, x = "total_bill", y = "tip",
            col = "time", height = 3.5)
# plt.show()
Rows and columns
Combine both arguments to create a grid with all the combinations of two variables.
import seaborn as sns
import matplotlib.pyplot as plt

tips = sns.load_dataset("tips")

sns.displot(data = tips, x = "total_bill",
            col = "time", row = "smoker", height = 2)
# plt.show()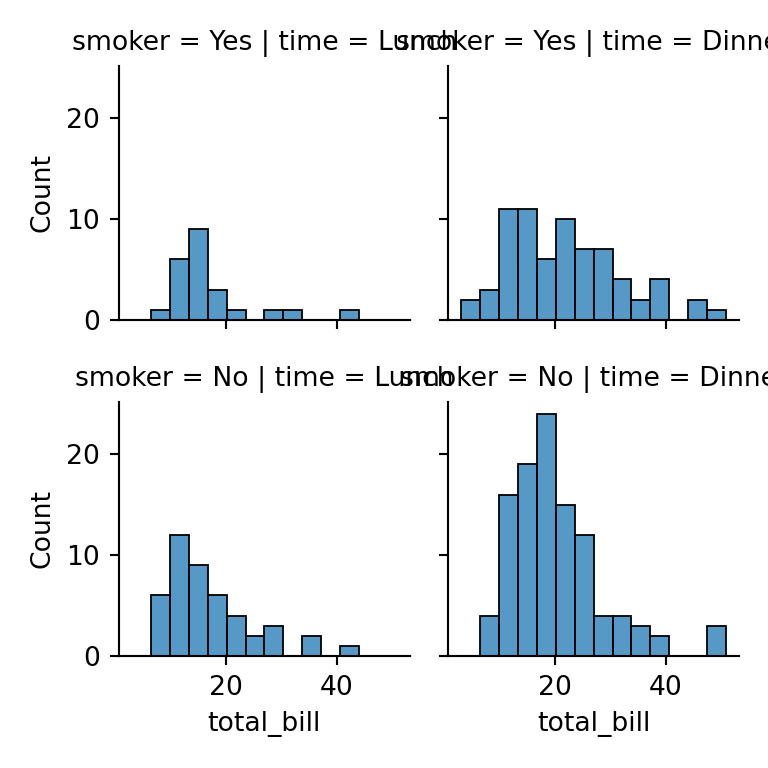
Wrap the facets with col_wrap
When a variable has many groups, col_wrap sets the maximum number of columns and the remaining facets continue in the next row.
import seaborn as sns
import matplotlib.pyplot as plt

tips = sns.load_dataset("tips")

sns.catplot(data = tips, x = "sex", y = "total_bill", kind = "box",
            col = "day", col_wrap = 2, height = 2)
# plt.show()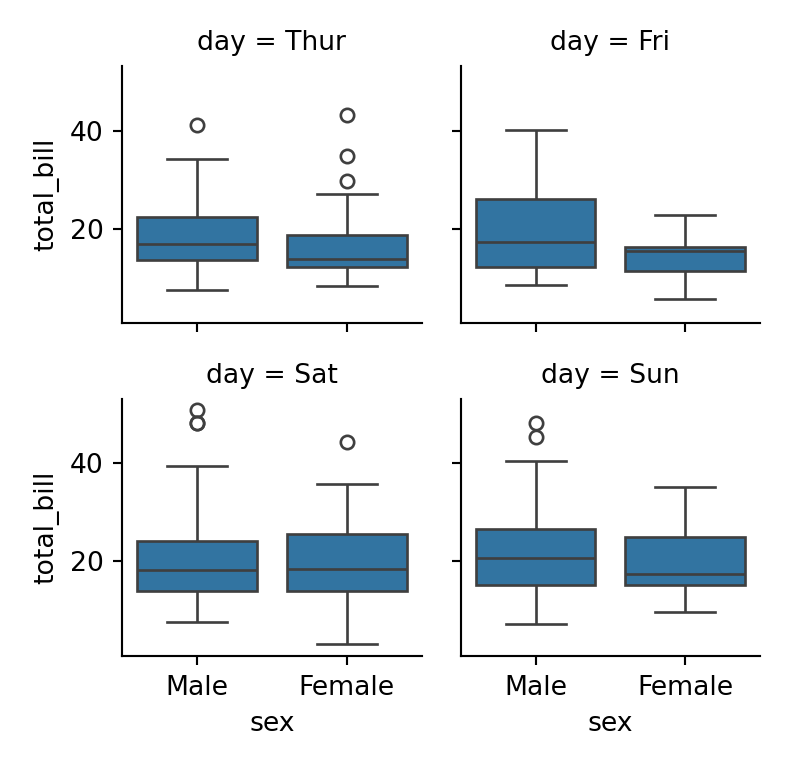
Facet titles
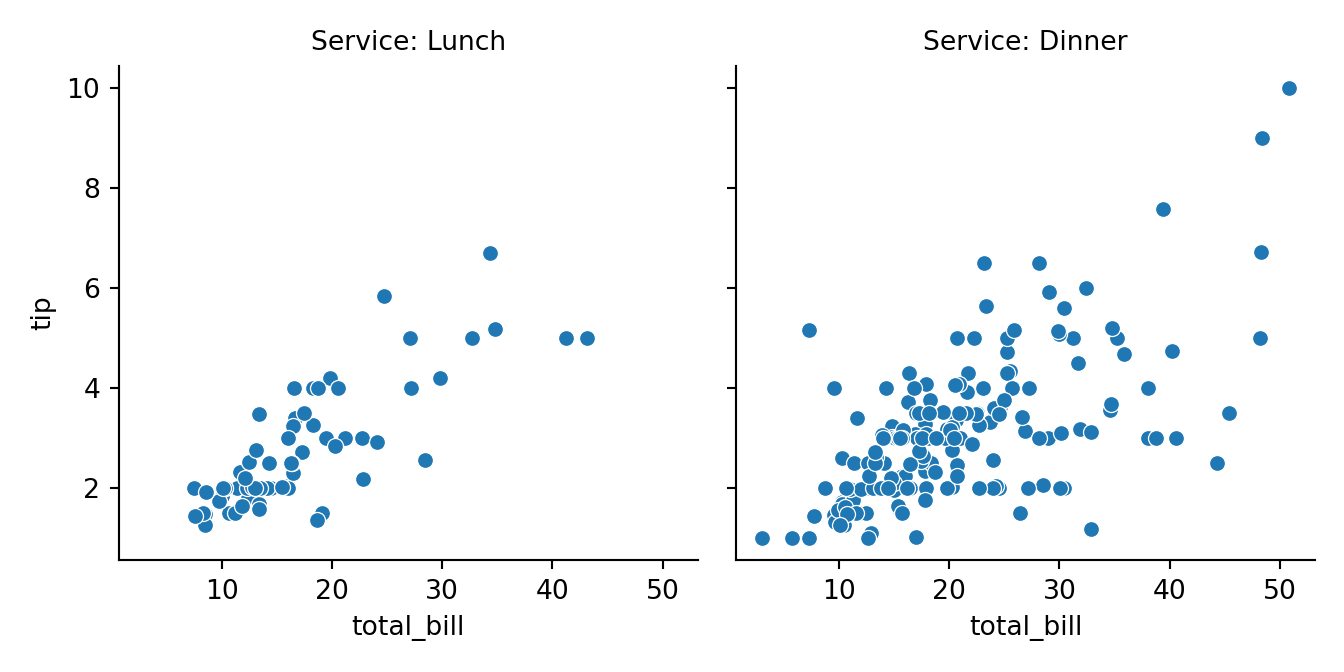
The titles of the facets can be changed with set_titles, where {col_name} and {row_name} are replaced with the value of each group. Add a general title with g.figure.suptitle.
import seaborn as sns
import matplotlib.pyplot as plt

tips = sns.load_dataset("tips")

g = sns.relplot(data = tips, x = "total_bill", y = "tip",
                col = "time", height = 3.5)

g.set_titles("Service: {col_name}")
g.figure.suptitle("Tips by time of the day", y = 1.05)
# plt.show()
Independent axes
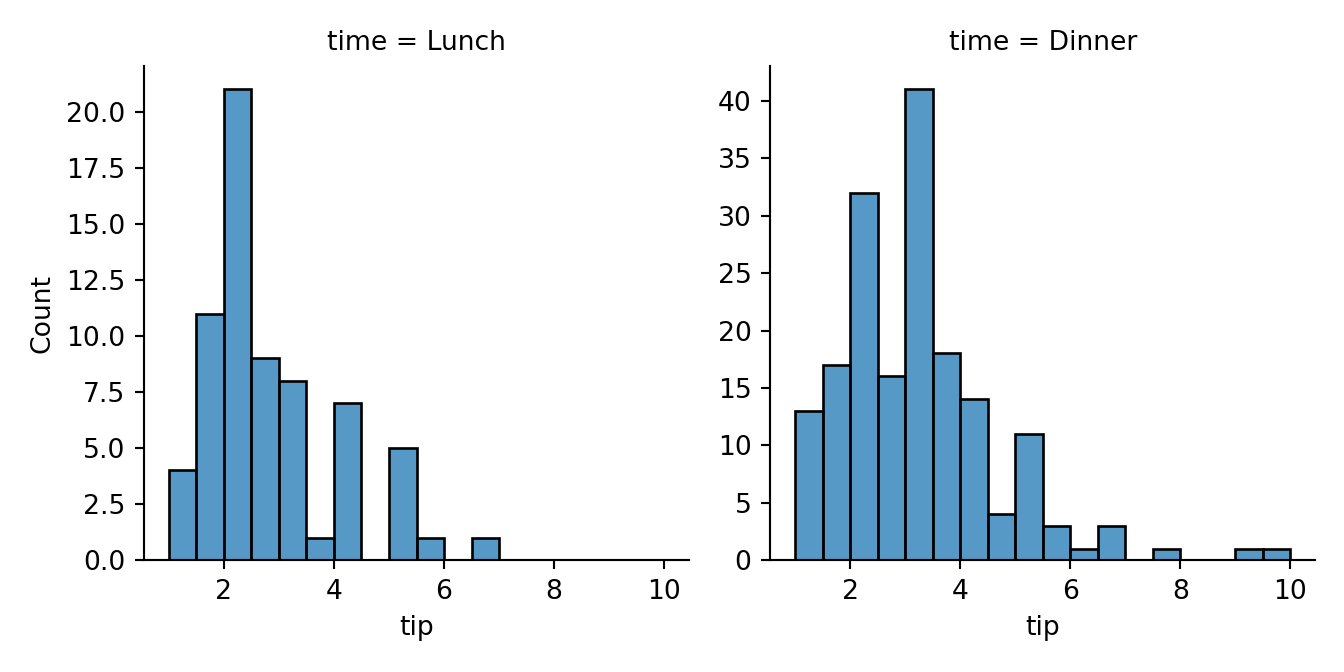
By default all the facets share the same axis limits, which makes comparisons easier. Use facet_kws = {"sharey": False} (or sharex) to allow each facet to have its own scale.
import seaborn as sns
import matplotlib.pyplot as plt

tips = sns.load_dataset("tips")

sns.displot(data = tips, x = "tip", col = "time", height = 3.5,
            facet_kws = {"sharey": False})
# plt.show()
Custom facets with FacetGrid
FacetGrid allows creating the grid first and drawing any plotting function on each facet with map or map_dataframe.
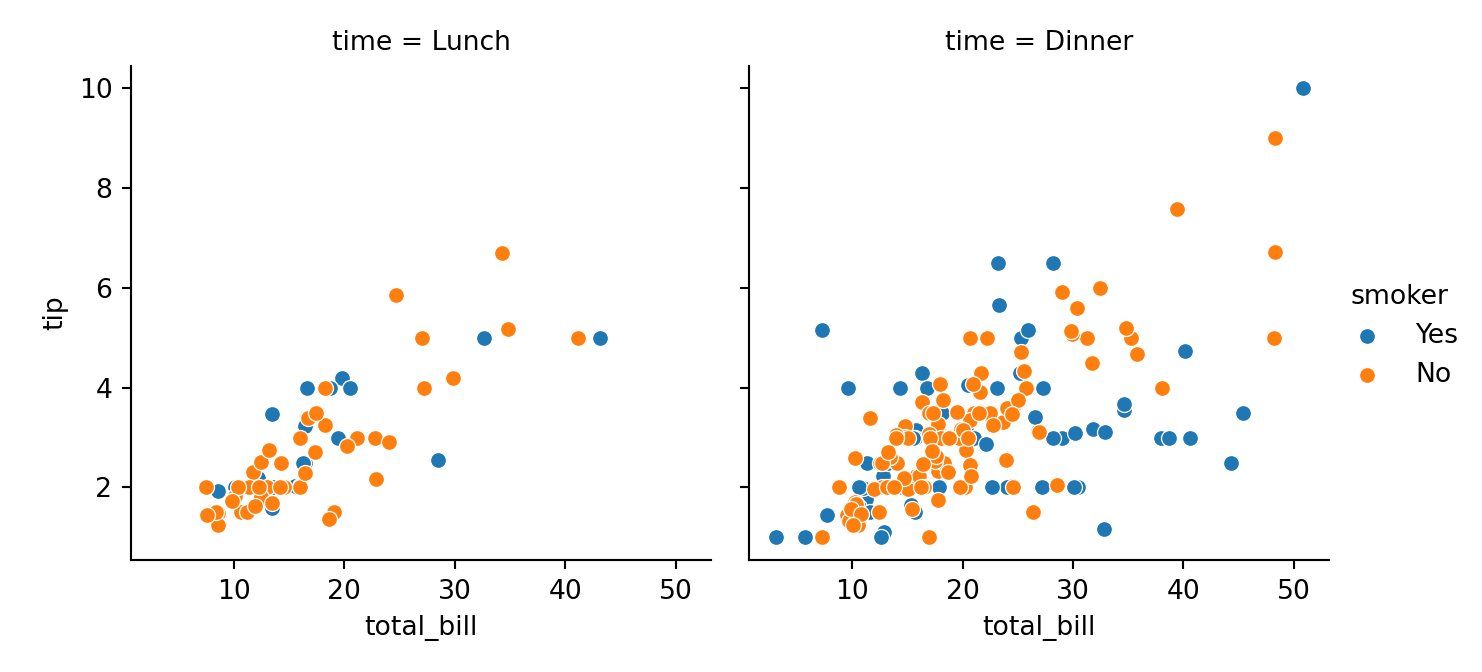
import seaborn as sns
import matplotlib.pyplot as plt

tips = sns.load_dataset("tips")

g = sns.FacetGrid(tips, col = "time", hue = "smoker", height = 3.5)
g.map_dataframe(sns.scatterplot, x = "total_bill", y = "tip")
g.add_legend()
# plt.show()
Customize each facet
The axes attribute of the grid contains the axes of each facet, so you can customize them individually with matplotlib, for instance adding a reference line.
import seaborn as sns
import matplotlib.pyplot as plt

tips = sns.load_dataset("tips")

g = sns.relplot(data = tips, x = "total_bill", y = "tip", col = "time")

for ax in g.axes.flat:
    ax.axhline(tips["tip"].mean(), color = "red", linestyle = "--")
# plt.show()
Learn how to change the size of the facets in the figure size in seaborn tutorial. To combine different types of plots in the same figure use matplotlib subplots.