Adding titles in matplotlib with title and set_title
Matplotlib allows adding titles to the charts by using the title or the set_title functions. The difference between these two functions is that the first is for adding a title for a single plot while the latter is for adding titles for subplots. The selection between each function will depend on the number of plots and the approach you want to use.
import matplotlib.pyplot as plt

fig, ax = plt.subplots()
ax.plot(range(5), marker = "o")

plt.title('Title of the plot')
# plt.show()


# Other approach:
fig, ax = plt.subplots()
ax.plot(range(5), marker = "o")

ax.set_title('Title of the plot')
# plt.show()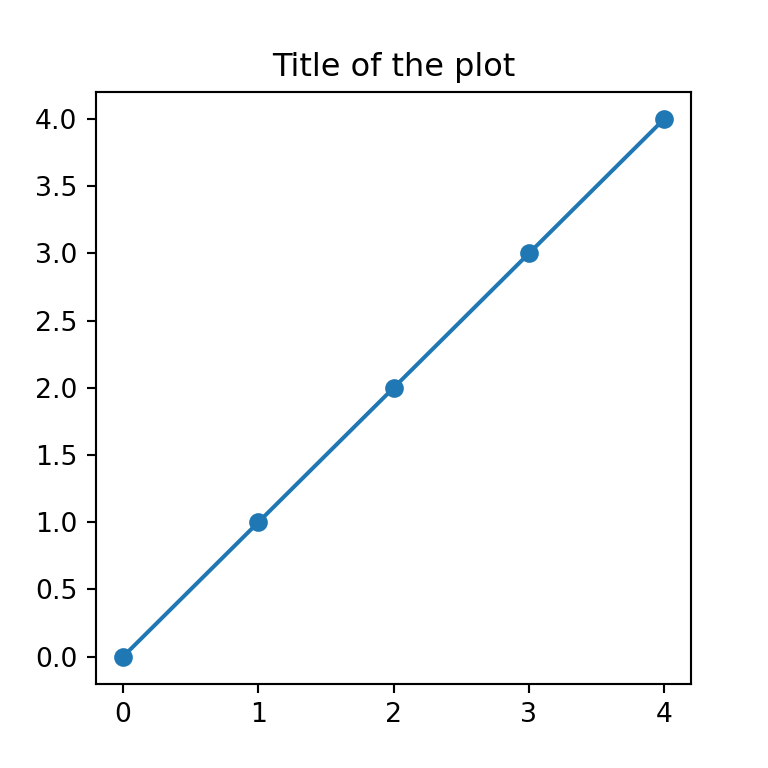
Title with multiple lines
Note that by using \n you will be able to break the lines and hence to set a title with multiple lines in Python.
import matplotlib.pyplot as plt

fig, ax = plt.subplots()
ax.plot(range(5), marker = "o")

plt.title('Title of the plot\nwith two lines')
# plt.show()
Title position
The title function provides the loc argument which defaults to "center", but you can also set the title position to the left or to the right with "left" or "right".
import matplotlib.pyplot as plt

fig, ax = plt.subplots()
ax.plot(range(5), marker = "o")

plt.title('Title of the plot at the right', loc = "right")
# plt.show()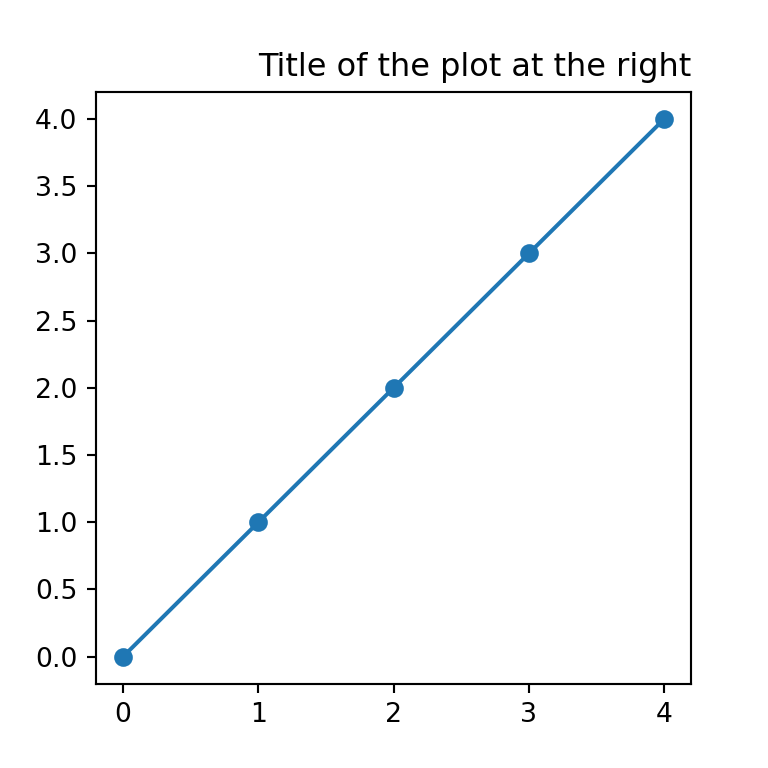
You can also use the pad argument to specify the offset of the title, in points, from the top of the axes.
Several titles
Using the title function several times you can add several titles, as long as they are in different position, otherwise the titles will be overwritten.
import matplotlib.pyplot as plt

fig, ax = plt.subplots()
ax.plot(range(5), marker = "o")

plt.title('First title', loc = "left")
plt.title('Second title', loc = "right")
# plt.show()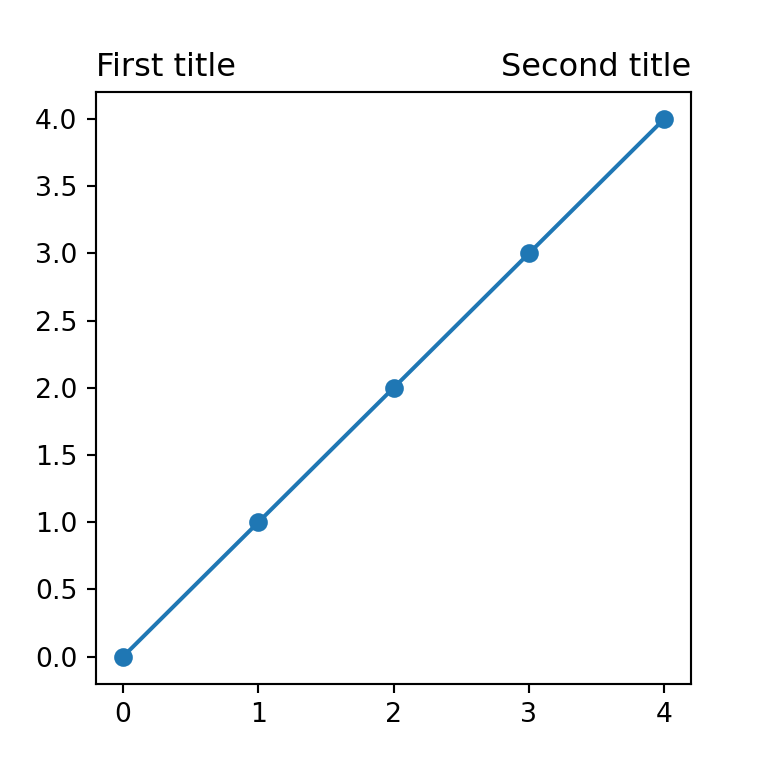
Title font size
The size of the font of the main title can be customized through the fontsize argument.
import matplotlib.pyplot as plt

fig, ax = plt.subplots()
ax.plot(range(5), marker = "o")

plt.title('Title of the plot', fontsize = 20)
# plt.show()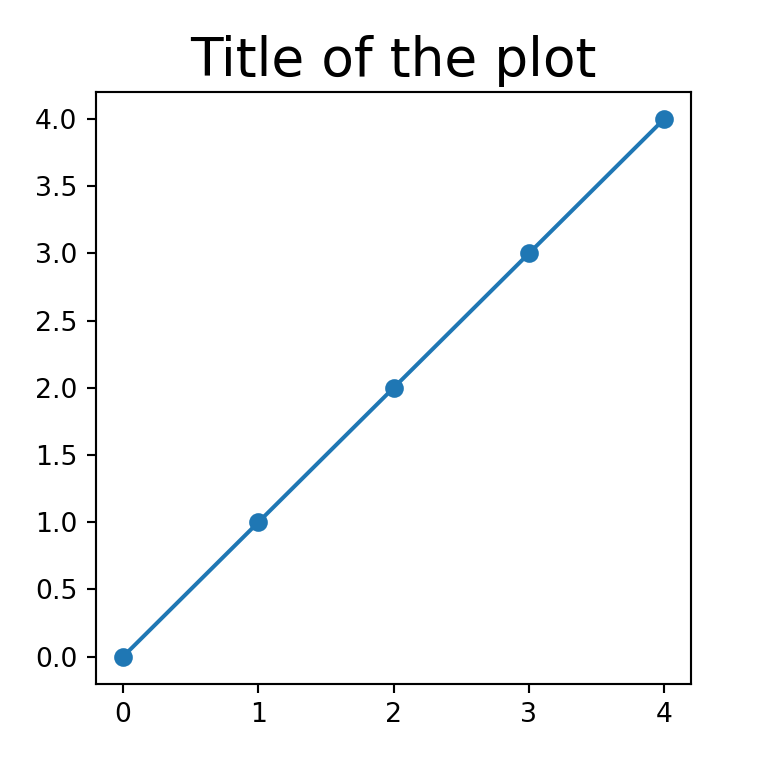
Title color
In addition, the color of the text can be changed by using the color argument, as shown below.
import matplotlib.pyplot as plt

fig, ax = plt.subplots()
ax.plot(range(5), marker = "o")

plt.title('Title of the plot', color = "red")
# plt.show()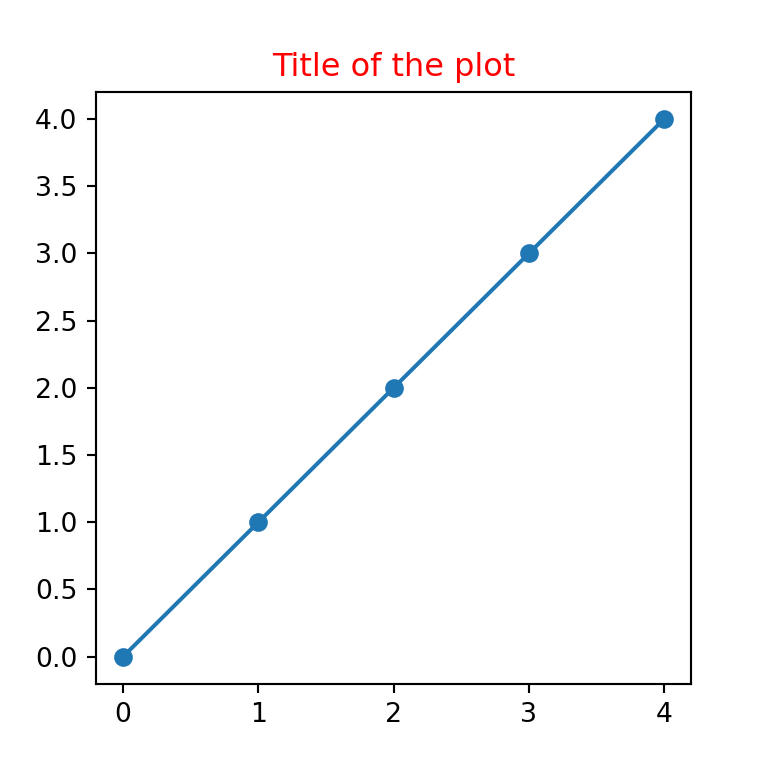
Title font style
You can also use a different font style, as bold or italic, by using the style argument.
import matplotlib.pyplot as plt

fig, ax = plt.subplots()
ax.plot(range(5), marker = "o")

plt.title('Title of the plot in italics', style = "italic")
# plt.show()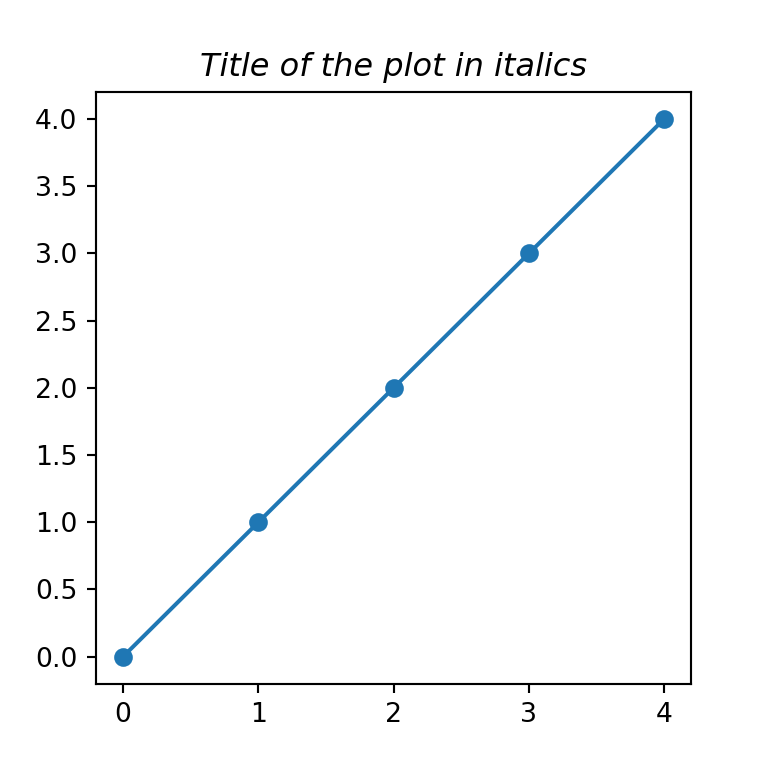
It is possible to customize the styling of the titles with a single dict named fontdict, where each key will be the arguments described before.
Mathematical expressions
It is worth to mention that you can use mathematical expressions in your titles. For this purpose, you will need to write your TeX code inside r'$ $', as in the following example:
import matplotlib.pyplot as plt

fig, ax = plt.subplots()
ax.plot(range(5), marker = "o")

plt.title(r'$\alpha > \beta$')
# plt.show()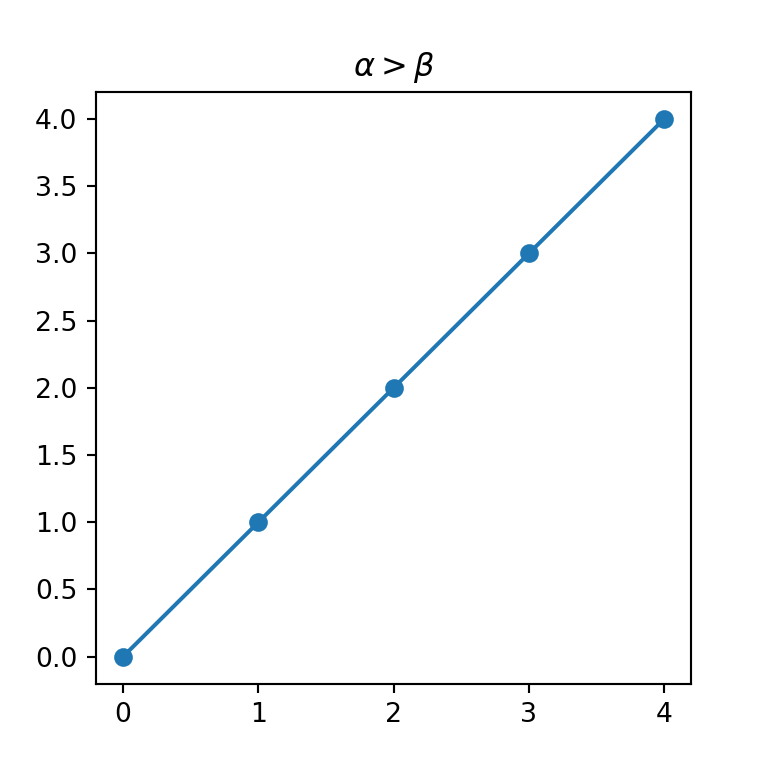
Figure title and subtitle with suptitle
Matplotlib also provides a function named suptitle, which can be used for adding subtitles or for adding figure titles.
Subtitle
The easiest way to add a subtitle in Python is using suptitle to set the main title and then setting the subtitle with title, as shown below.

import matplotlib.pyplot as plt

fig, ax = plt.subplots()
ax.plot(range(5), marker = "o")

fig.suptitle('Main title')
plt.title('Subtitle')
# plt.show()
Figure title
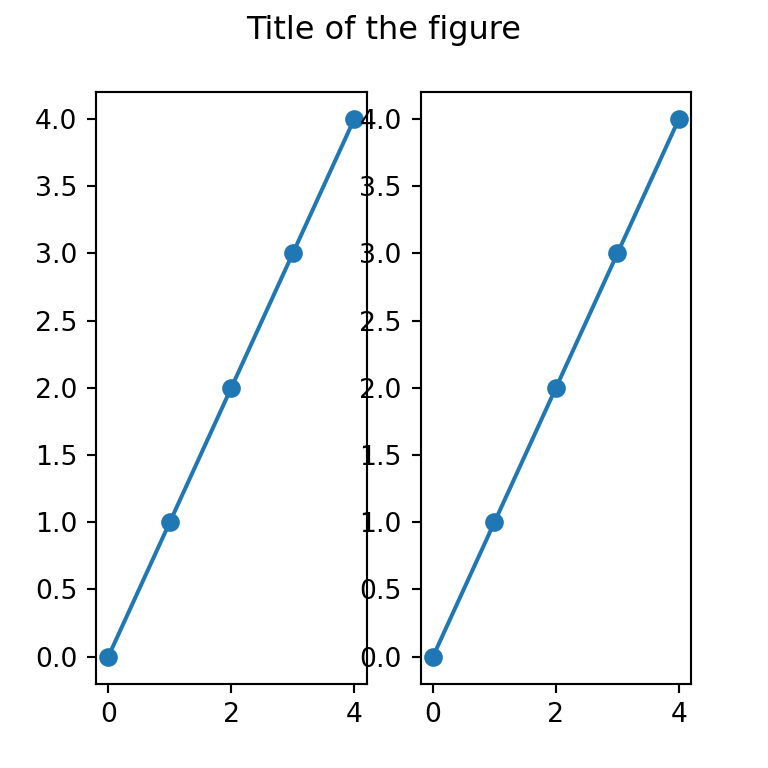
However, the suptitle function is designed to set a figure-level title, so in case you want to add an overall title for several plots you can use it.
import matplotlib.pyplot as plt

fig, (ax1, ax2) = plt.subplots(1, 2)

# Plots
ax1.plot(range(5), marker = "o")
ax2.plot(range(5), marker = "o")

fig.suptitle('Title of the figure')

# plt.show()
Subplot titles
Note that you can also add individual titles for each subplot by using the set_title function.

import matplotlib.pyplot as plt

fig, (ax1, ax2) = plt.subplots(1, 2)

# Plots
ax1.plot(range(5), marker = "o")
ax2.plot(range(5), marker = "o")

fig.suptitle('Title of the figure')

# Titles for each plot
ax1.set_title('First title')
ax2.set_title('Second title')

# plt.show()


