Leaflet maps with folium
The folium library is the Python leaflet JS library implementation. In order to create an interactive map you will need to specify the desired coordinates with location and the desired level of zoom with zoom_start.
Basic map
import folium

# Interactive map
m = folium.Map(location = [34.06, -118.25], zoom_start = 8)
mBase maps
The tiles argument allows specifying different base maps, such as "Stamen Terrain", "CartoDB Positron", "stamentoner", etc. The default value is "OpenStreetMap" and you can find more leaflet providers online.
Stamen Terrain
import folium

# Interactive map
m = folium.Map(location = [34.06, -118.25], zoom_start = 8,
               tiles = "Stamen Terrain")
mCartoDB Positron
import folium

# Interactive map
m = folium.Map(location = [34.06, -118.25], zoom_start = 8,
               tiles = "CartoDB Positron")
mIf you want to use Cloudmade or Mapbox tiles you will need to set your API key with the API_key argument.
Markers
Markers can be added to folium maps with folium.Marker and add_to functions. After creating you map you will ble able to add the marker, specifying the desired location, as in the example below.
import folium

m = folium.Map(location = [34.06, -118.25], zoom_start = 8)

# Add a marker to the map
folium.Marker(location = [34.06, -118.25]).add_to(m)

mMarkers with icon
The markers can also have a bootstrap icon and a custom color. You will need to pass folium.Icon to the icon argument with the desired icon and color.
import folium

m = folium.Map(location = [34.06, -118.25], zoom_start = 8)

# Add a marker with icon to the map
folium.Marker(location = [34.06, -118.25],
              icon = folium.Icon(icon = "cloud", color = "red")).add_to(m)

mCircle markers
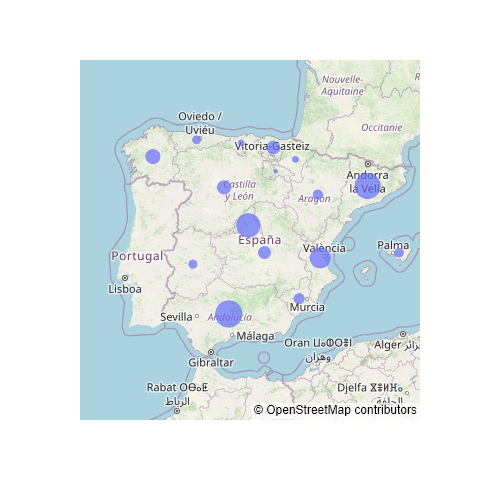
Markers can also be circles that can be added with CircleMarker. These markers can be customized in several ways, as it is possible to customize the radius (in pixels), the fill and border color or the opacity.
import folium

m = folium.Map(location = [34.06, -118.25], zoom_start = 8)

# Add a circle marker
folium.CircleMarker(
    location = [34.06, -118.25],
    radius = 10,
    fill = True,
    color = "blue",
    fill_color = "red",
    fill_opacity = 0.25).add_to(m)

mAdding several markers at once
Note that you can add as many markers as you want. If you have a data frame containing coordinates for several points you can add them at once using a for loop as in the following block of code.
import folium
import pandas as pd

# Coordinates
coords = pd.DataFrame({'lon': [34.06, 34.17, 34.42],
                       'lat': [-118.25, -118.40, -118.89]})

m = folium.Map(location = [34.06, -118.25], zoom_start = 8)

# Add several markers to the map
for index, row in coords.iterrows():
  folium.Marker(location = [row["lon"], row["lat"]]).add_to(m)

mCircles
Circles are similar to circle markers, but the difference is that the radius of circles is measured in meters while circle markers are measured in pixels. These circles can be used for instance to show an influence area of a store.
import folium

m = folium.Map(location = [34.06, -118.25], zoom_start = 8)

# Circle with a radius of 50km
folium.Circle(
    location = [34.06, -118.25],
    radius = 50000,
    color = "red",
    fill = True,
    fill_color = "blue").add_to(m)

mRectangles
Similar to circles, rectangles can be added to the map, but you will need to specify the coordinates (bounds) of the rectangle, as in the example below.
import folium

m = folium.Map(location = [34.06, -118.25], zoom_start = 8)

# Rectangle coordinates
upper_left = [34.15, -118.44]
upper_right = [34.15, -118.06]
lower_right = [33.89, -118.06]
lower_left = [33.89, -118.44]

# Rectangle
folium.Rectangle(
  bounds = [upper_left, upper_right, lower_right, lower_left],
  stroke = True,
  fill = True,
  color = "blue",
  fill_color = "#3388ff",
  fill_opacity = 0.5).add_to(m)

mPolygons (GeoJSON)
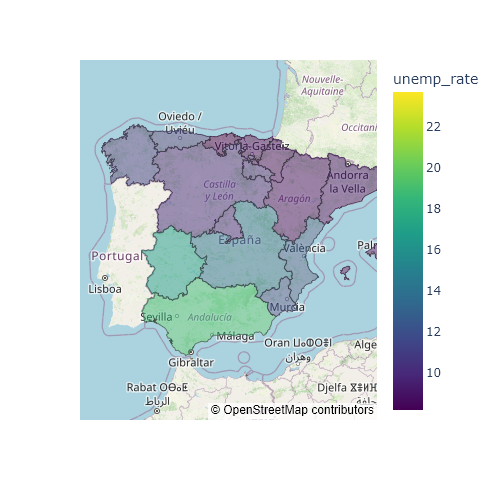
It is possible to add polygons to the folium maps with the GeoJson function. You just need to pass the geojson file to data, set a name to the layer with name and add optional styling with style_function.
import folium

m = folium.Map(location = [38.34, -0.49], zoom_start = 13)

# Geojson url
geojson_url = "https://raw.githubusercontent.com/R-CoderDotCom/data/main/sample_geojson.geojson"

# Desired styles
style = {'fillColor': 'red', 'color': 'blueviolet'}

# Geojson
folium.GeoJson(data = geojson_url, name = "geojson",
    style_function = lambda x:style).add_to(m)

mPop-ups
Most of the functions provide an argument named popup that can be used to show a message when the layer is clicked. Try to click in the following circle marker to see the popup.
import folium

m = folium.Map(location = [34.06, -118.25], zoom_start = 8)

# Add a circle marker with a popup
folium.CircleMarker(
    location = [34.06, -118.25],
    fill = True,
    popup = "Pop up message!").add_to(m)

mLayers
It is possible to select or unselect different layers. Consider that you have a map with circle markers and with other markers or layers. You will need to use the FeatureGroup function and then LayerControl, so you will be able to select or unselect the layers.
import folium

m = folium.Map(location = [34.06, -118.25], zoom_start = 8)

# Add a circle marker
folium.CircleMarker(
    location = [34.06, -118.25]).add_to(folium.FeatureGroup(name = 'Circle Marker').add_to(m))

# Add a marker
folium.Marker(
    location = [34.14, -118.35]).add_to(folium.FeatureGroup(name = 'Marker').add_to(m))

# Add the layer control
folium.LayerControl().add_to(m)

mFolium plugins
Folium provides built-in plugins with additional features. In the following subsections we will highlight some of the best plugins available, but you will find more in the original documentation.
Mini map
You can add a mini map to folium adding plugins.MiniMap() to the map. By default, it will display a small map at the bottom right.
import folium
from folium import plugins

m = folium.Map(location = [34.06, -118.25], zoom_start = 8)

plugins.MiniMap().add_to(m)

m
Terminator
The terminator shows the separation between the day and the night at the exact moment the map was created.
import folium
from folium import plugins

m = folium.Map(location = [34.06, -118.25], zoom_start = 1)

plugins.Terminator().add_to(m)

m
Geocoder
An interesting plugin is Gocoder, which adds a search bar so you will to be able to look for different places.
import folium
from folium import plugins

m = folium.Map(location = [34.06, -118.25], zoom_start = 1)

plugins.Geocoder().add_to(m)

m
Cluster marker
In case you have too many markers you can cluster them with MarkerCluster depending on the zoom level. You can also click over the clusters to zoom over them.
import folium
from folium import plugins
import numpy as np

# Sample longitudes and latitudes
data = np.array([np.random.uniform(low = 25, high = 50, size = 100),
                 np.random.uniform(low = -125, high = -70, size = 100)]).T

m = folium.Map([40, -100], zoom_start = 3)

plugins.MarkerCluster(data).add_to(m)

m
Heat map
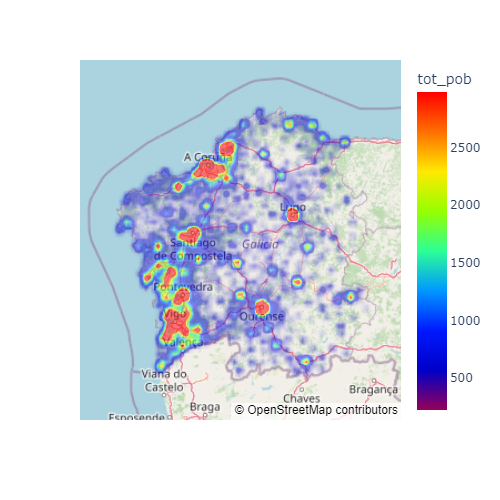
Finally, if you want to create a heat map you can import HeatMap from folium.plugins with from folium.plugins import HeatMap and then use the HeatMap function in order to display your data.
import folium
from folium import plugins
from folium.plugins import HeatMap
import numpy as np

# Sample longitudes and latitudes
data = np.array([np.random.normal(35, 2, size = 100),
                 np.random.normal(-80, 2, size = 100)]).T

m = folium.Map([35, -80], zoom_start = 5)

HeatMap(data).add_to(m)

m


