Seaborn built-in themes
The seaborn library provides five different built-in themes named: "darkgrid", "whitegrid", "dark", "white" and "ticks". You can select them both with the style argument of the set_style or set_style function. Note that if you are using set_theme you will need to specify the name of the argument, as unlike set_style, it is not the first.
darkgrid
If you set the set_style function without any arguments the "darkgrid" theme will be used by default, which adds a gray background and white grid lines.
import seaborn as sns

df = sns.load_dataset("tips")

sns.set_theme()
# Equivalent to:
# sns.set_style("darkgrid")

sns.boxplot(x = "day", y = "total_bill", data = df)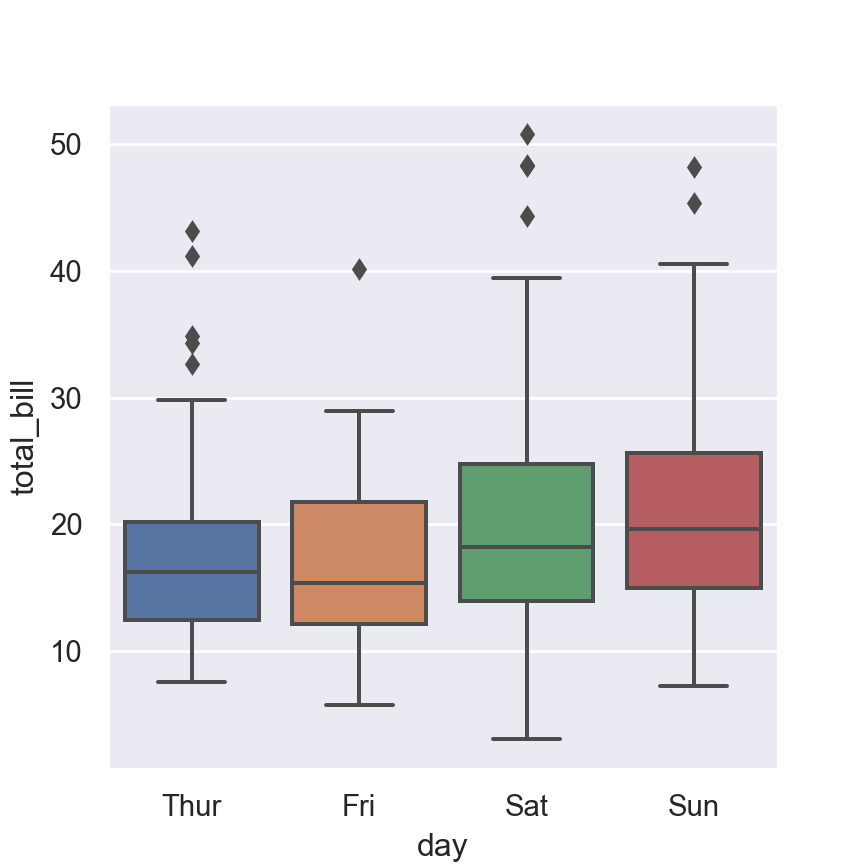
whitegrid
If you want to add gray grid lines but with a white background set this theme.
import seaborn as sns

df = sns.load_dataset("tips")

sns.set_style("whitegrid")

sns.boxplot(x = "day", y = "total_bill", data = df)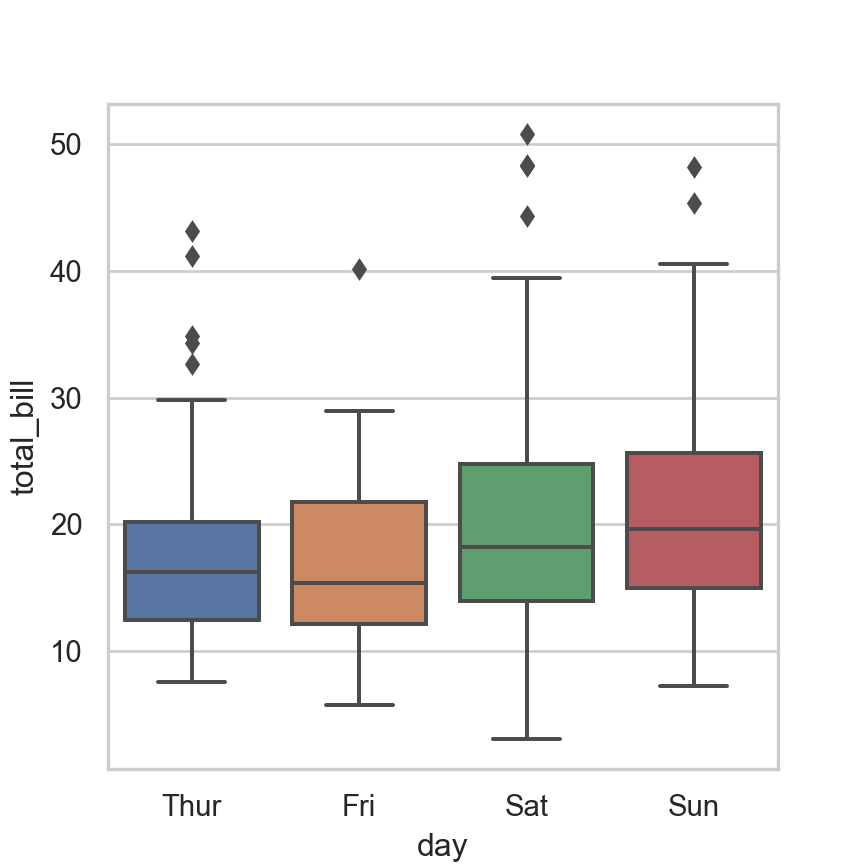
dark
The "dark" theme is the same as "darkgrid" but without the grid lines.
import seaborn as sns

df = sns.load_dataset("tips")

sns.set_style("dark")

sns.boxplot(x = "day", y = "total_bill", data = df)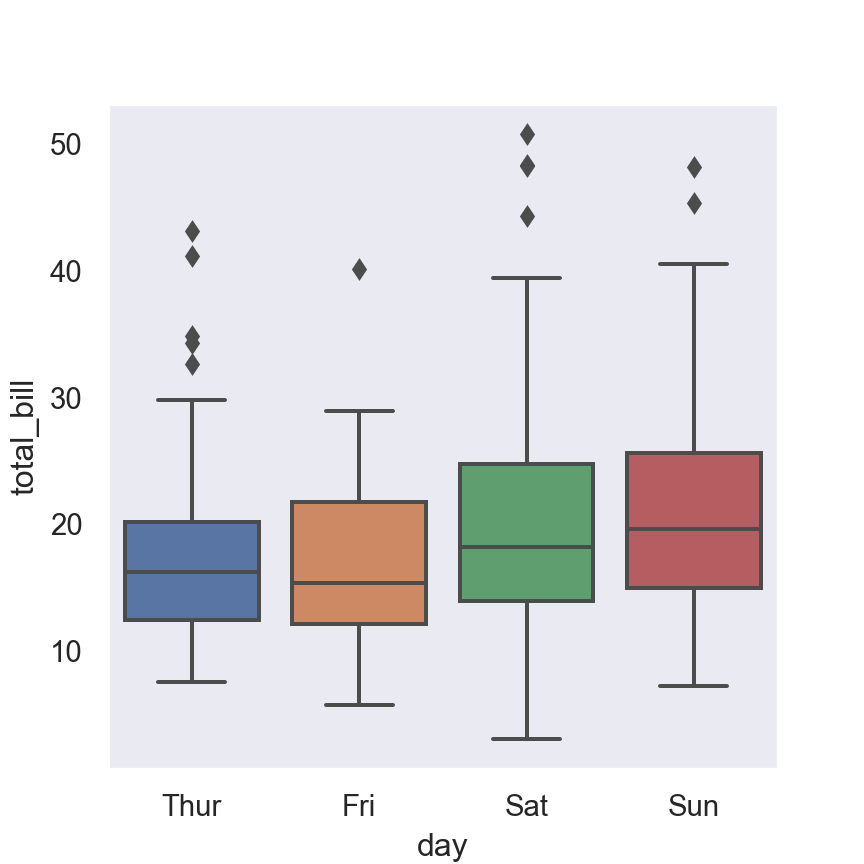
white
The "white" theme is the same as "whitegrid" but without the gray grid lines.
import seaborn as sns

df = sns.load_dataset("tips")

sns.set_style("white")

sns.boxplot(x = "day", y = "total_bill", data = df)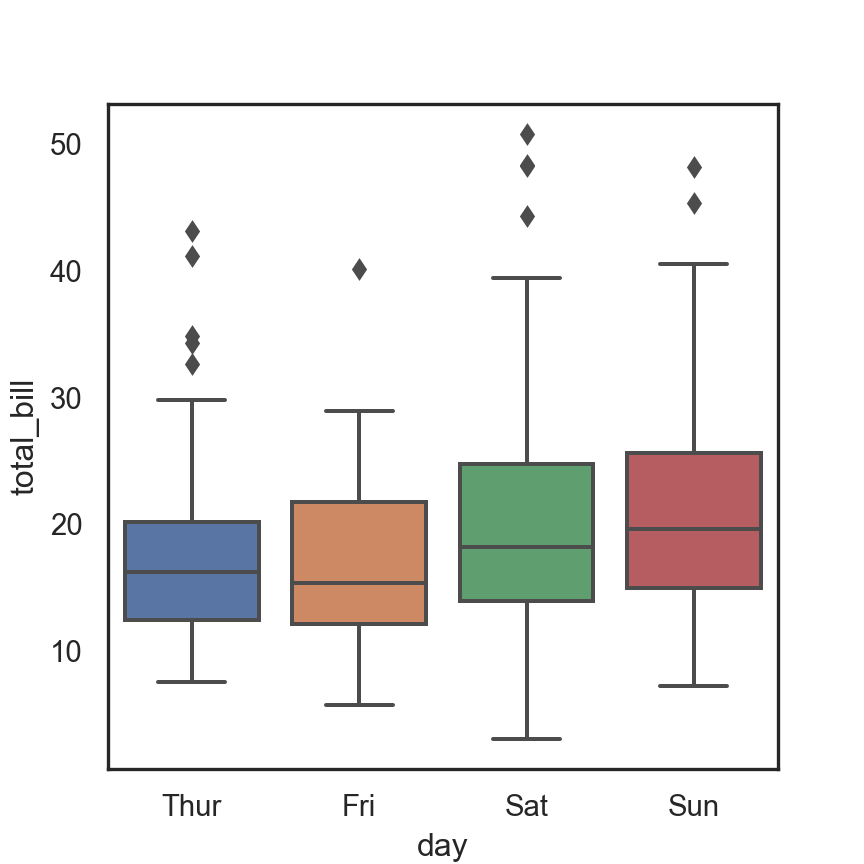
ticks
The "ticks" theme is the same as the "white" theme but this theme adds ticks to the axes.
import seaborn as sns

df = sns.load_dataset("tips")

sns.set_style("ticks")

sns.boxplot(x = "day", y = "total_bill", data = df)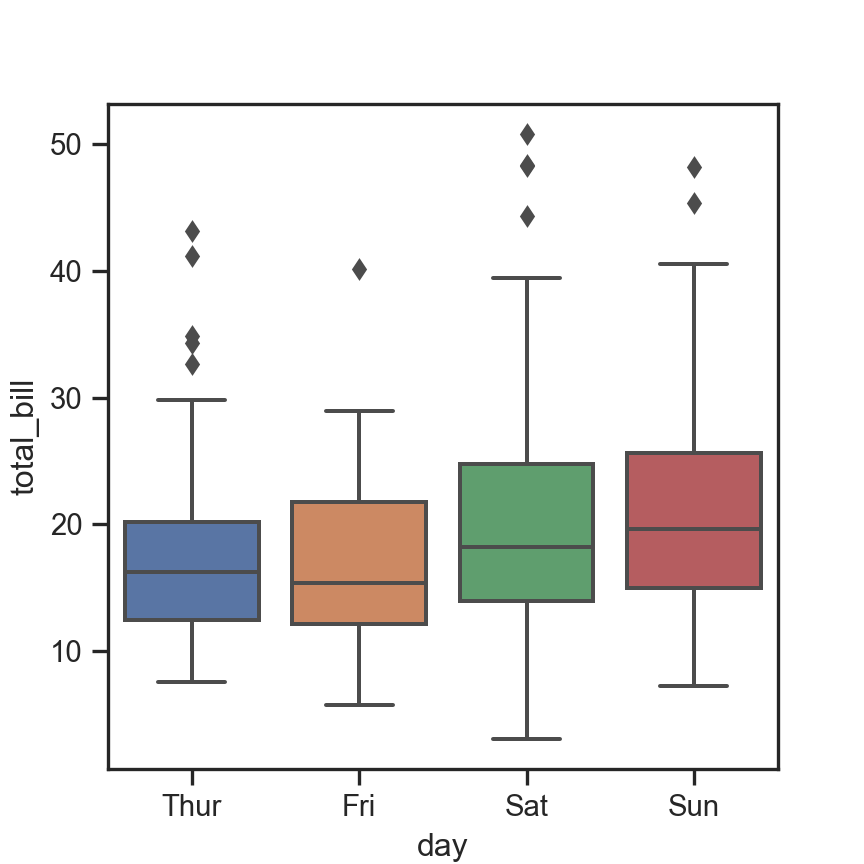
Customizing the themes
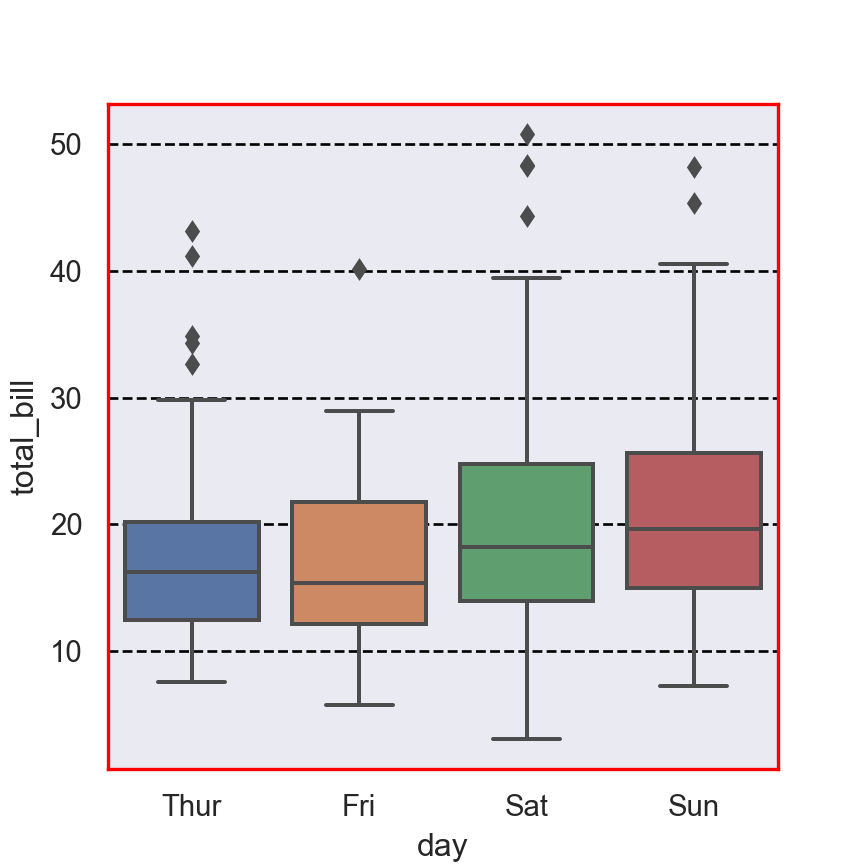
The functions used to add themes provide an argument named rc that can be used to customize the styling of the selected theme. In the following example we are changing some arguments but note that you can get the full list of arguments calling the axes_style() function.
import seaborn as sns

df = sns.load_dataset("tips")

# Get the full list of styles
sns.axes_style()

custom = {"axes.edgecolor": "red", "grid.linestyle": "dashed", "grid.color": "black"}
sns.set_style("darkgrid", rc = custom)

sns.boxplot(x = "day", y = "total_bill", data = df)


