Adding a grid in seaborn with the set_style function
By default, the plots created with seaborn doesn’t have a grid. If you want to add an automatic grid based on your plot you can use the set_style function and choose between the "whitegrid" and "darkgrid" styles.
whitegrid
import seaborn as sns

x = ["A", "A", "A", "B"]

sns.set_style("whitegrid")
sns.countplot(x = x)
darkgrid
import seaborn as sns

x = ["A", "A", "A", "B"]

sns.set_style("darkgrid")
sns.countplot(x = x)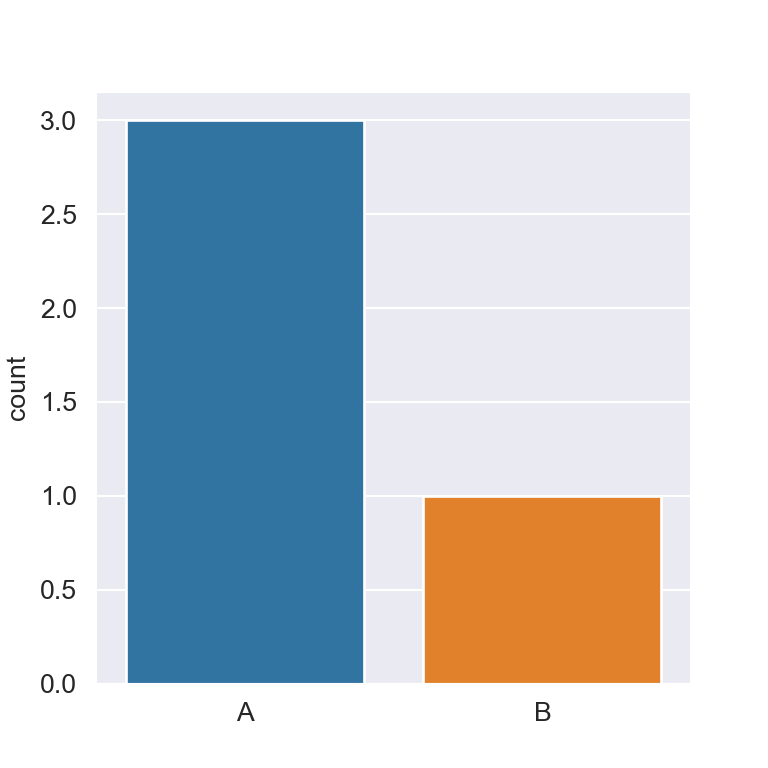
In the following sections we will review how to pass additional arguments to customize the styling of the grids. Note that you can see the full list of parameters with axes_style().
Color of the grid

Use grid.color as in the example below to specify a color for the grid, which defaults to gray for "whitegrid" and to white for "darkgrid".
import seaborn as sns

x = ["A", "A", "A", "B"]

sns.set_style("whitegrid", {'grid.color': 'red'})
sns.countplot(x = x)
Grid style
grid.linestyle controls the style of the line of the grid. Possible options are '-' (default) or 'solid', '--' or 'dashed', '-.' or 'dashdot' and ':' or 'dotted', as displayed below.
Dashed line
import seaborn as sns

x = ["A", "A", "A", "B"]

sns.set_style("whitegrid", {'grid.linestyle': '--'})
sns.countplot(x = x)
Dotted line
import seaborn as sns

x = ["A", "A", "A", "B"]

sns.set_style("whitegrid", {'grid.linestyle': ':'})
sns.countplot(x = x)
Dash-dot line
import seaborn as sns

x = ["A", "A", "A", "B"]

sns.set_style("whitegrid", {'grid.linestyle': '-.'})
sns.countplot(x = x)


