The stem function
The matplotlib stem function allows creating stem plots, also known as lollipop charts, in Python. You will need to pass your input data to the function with the locations and values to create a simple stem plot in Python.
import matplotlib.pyplot as plt
import numpy as np

# Data
x = np.arange(2, 12, 1)
y = x ** 2

# Stem plot
fig, ax = plt.subplots()
ax.stem(x, y)
# plt.show()
Horizontal stem plot
By default, the stem plots are displayed in vertical mode, but you can create an horizontal chart setting the orientation argument to "horizontal", as in the example below.
import matplotlib.pyplot as plt
import numpy as np

# Data
x = np.arange(2, 12, 1)
y = x ** 2

# Stem plot
fig, ax = plt.subplots()
ax.stem(x, y, orientation = "horizontal")
# plt.show()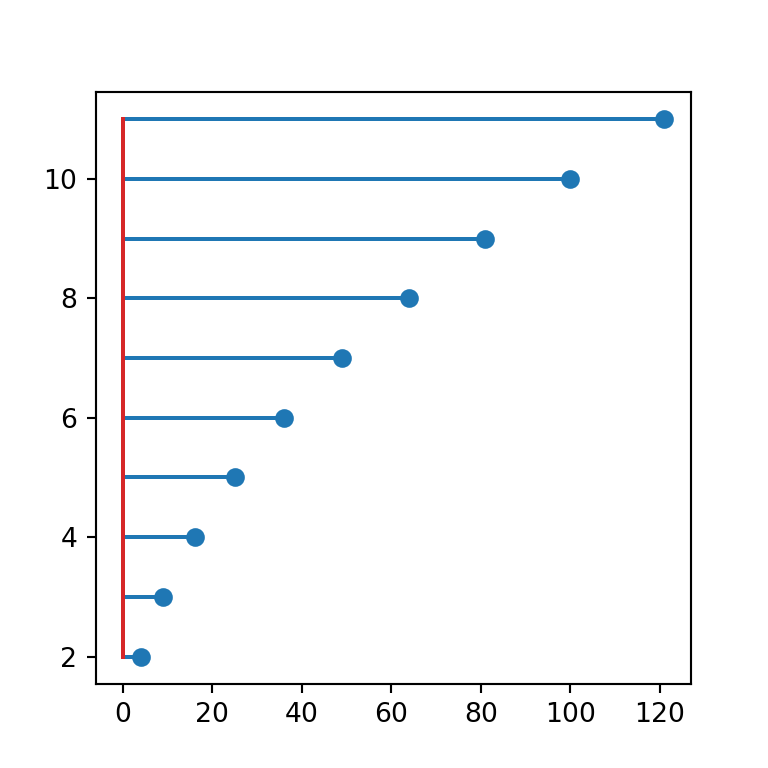
Bottom
Note that the base line in red is set to zero by default, but you can override its position with the bottom argument.
import matplotlib.pyplot as plt
import numpy as np

# Data
x = np.arange(2, 12, 1)
y = x ** 2

# Stem plot
fig, ax = plt.subplots()
ax.stem(x, y, bottom = 60)
# plt.show()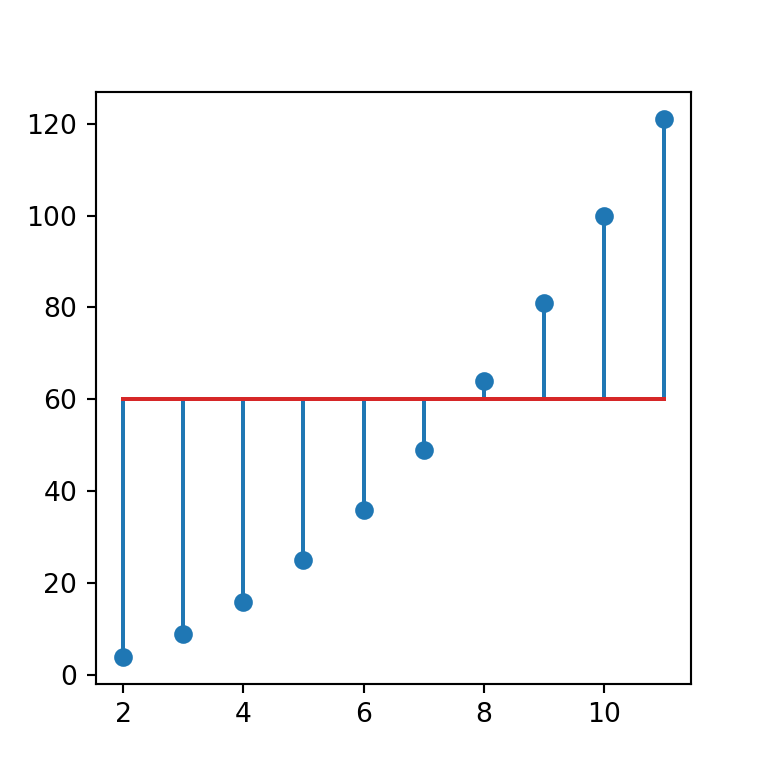
Styling of the lollipop charts
The stem function provides three arguments to style the plot: linefmt for the lines, markerfmt for the markers and basefmt for the base line.
Color of the lines
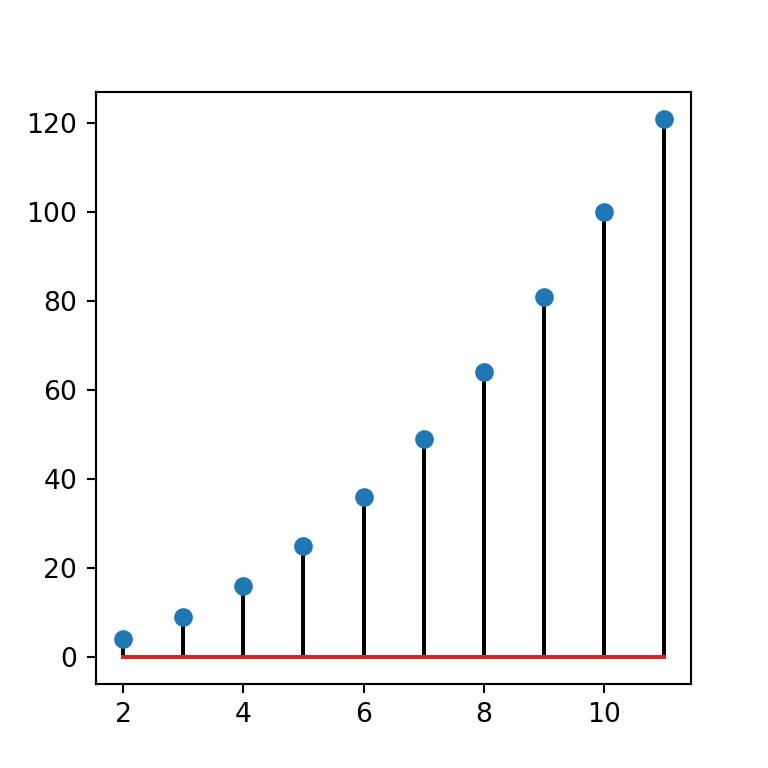
In order to change the color of the lines you can pass a new color to the linefmt argument, as in the example below.
import matplotlib.pyplot as plt
import numpy as np

# Data
x = np.arange(2, 12, 1)
y = x ** 2

# Stem plot
fig, ax = plt.subplots()
ax.stem(x, y, linefmt = 'black')
# plt.show()
Line style
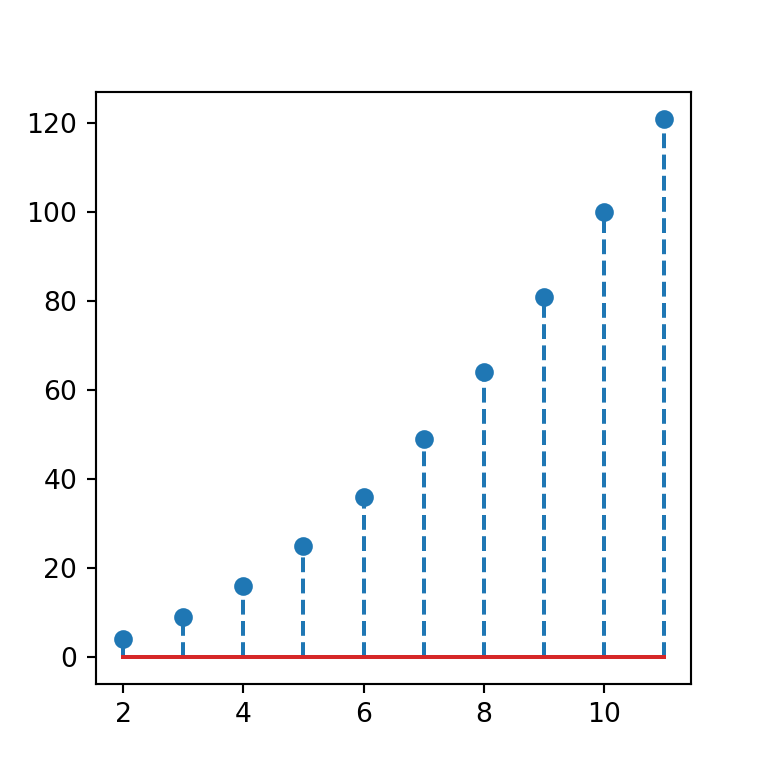
Note that the same argument used to change the line color can also be used to customize the line style.
import matplotlib.pyplot as plt
import numpy as np

# Data
x = np.arange(2, 12, 1)
y = x ** 2

# Stem plot
fig, ax = plt.subplots()
ax.stem(x, y, linefmt = '--')
# plt.show()
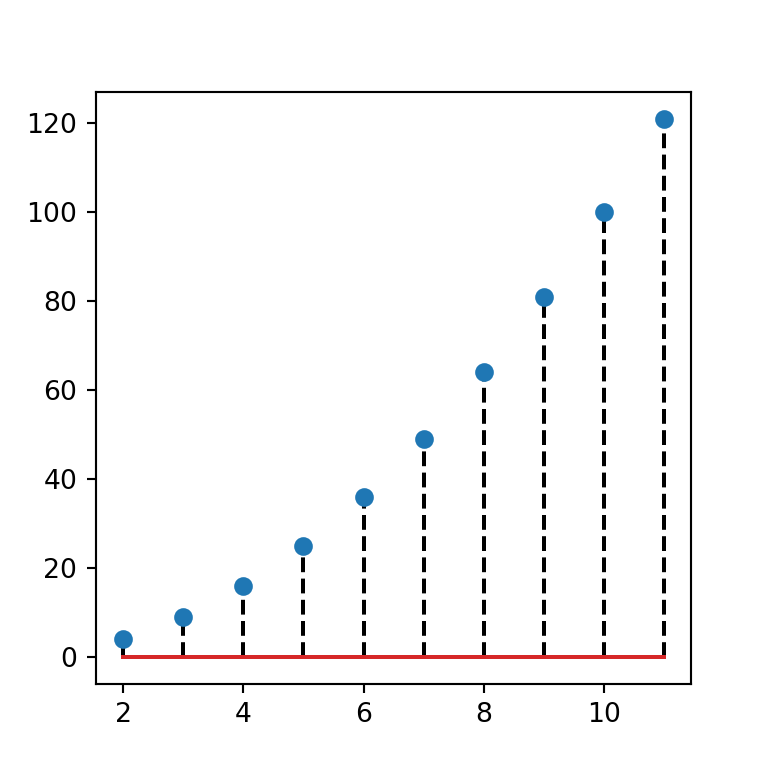
Color and style of the lines at the same time
Moreover, this argument also allows to set a new color and line style at the same time, indicating a new color (e.g. k for black) and line type (-- for a dashed line).
import matplotlib.pyplot as plt
import numpy as np

# Data
x = np.arange(2, 12, 1)
y = x ** 2

# Stem plot
fig, ax = plt.subplots()
ax.stem(x, y, linefmt = 'k--')
# plt.show()
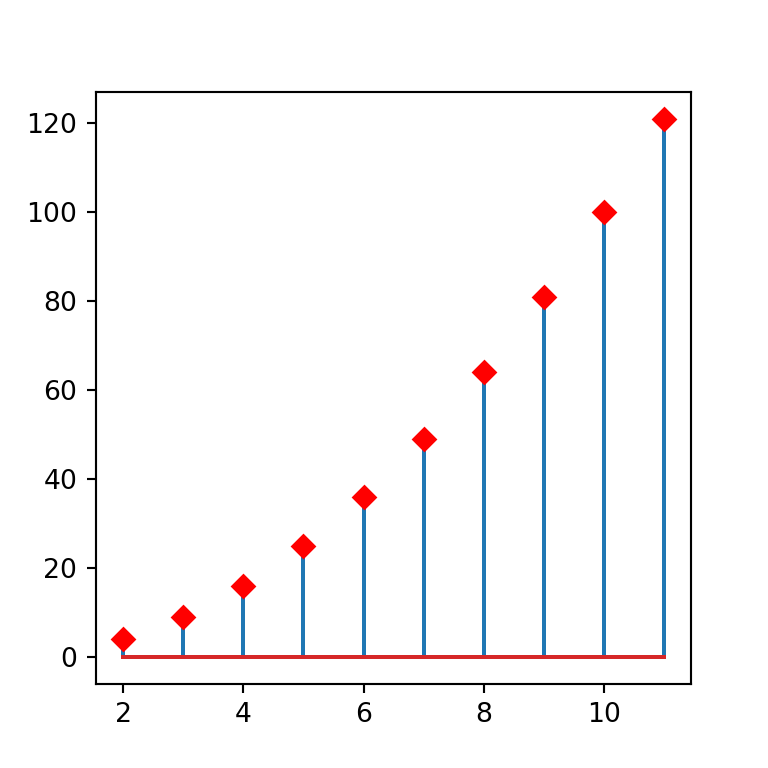
Markers styling
The markerfmt argument allows customizing the color and shape of the markers of the lollipop. In the example below we are setting red (r) diamonds (D) as marker.
import matplotlib.pyplot as plt
import numpy as np

# Data
x = np.arange(2, 12, 1)
y = x ** 2

# Stem plot
fig, ax = plt.subplots()
ax.stem(x, y, markerfmt = 'Dr')
# plt.show()
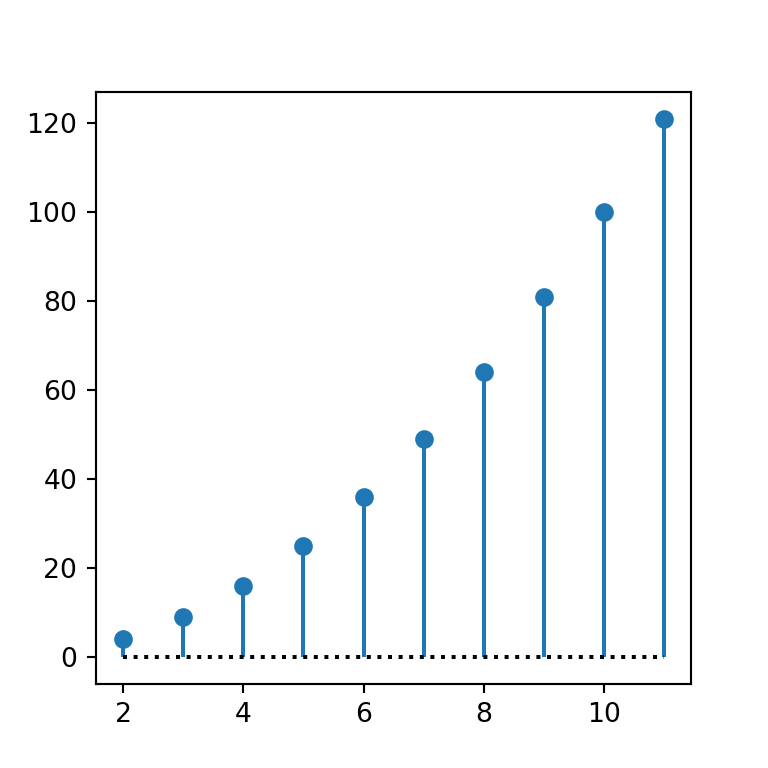
Base line customization
The base line color and style can be customized the same way as the other lines but using the basefmt argument. In the following example we are setting a dotted black line.
import matplotlib.pyplot as plt
import numpy as np

# Data
x = np.arange(2, 12, 1)
y = x ** 2

# Stem plot
fig, ax = plt.subplots()
ax.stem(x, y, basefmt = 'k:')
# plt.show()
Stem plot by group
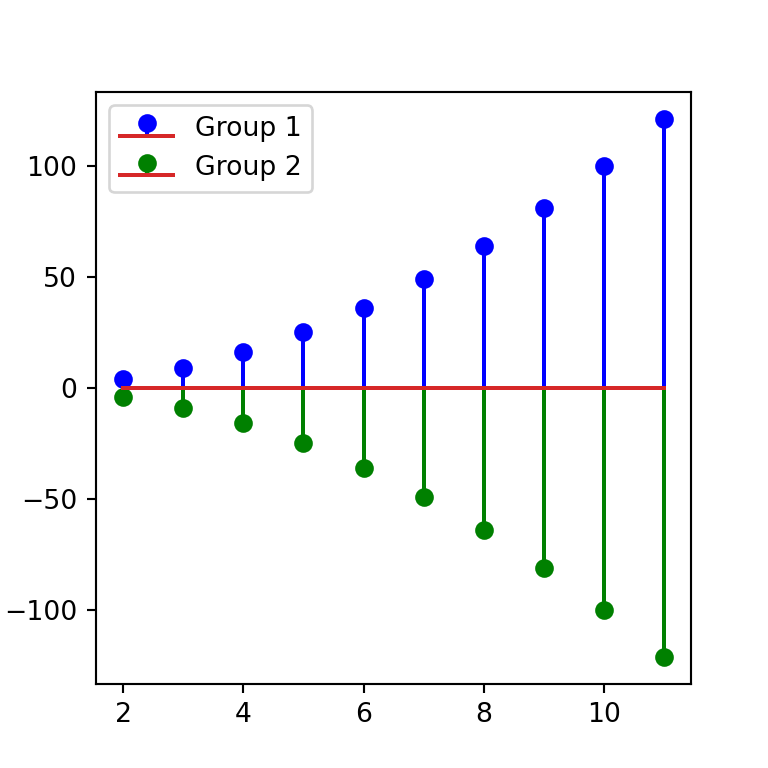
Finally, it is worth to mention that you can create a lollipop chart by group in Python just writing a new line. In order to add a legend set the label with the label argument and use the legend function.
import matplotlib.pyplot as plt
import numpy as np

# Data
x = np.arange(2, 12, 1)
y = x ** 2

x2 = np.arange(2, 12, 1)
y2 = -y

# Stem plot
fig, ax = plt.subplots()
ax.stem(x, y, 'b', markerfmt = 'bo', label = "Group 1")
ax.stem(x2, y2, 'g', markerfmt = 'go', label = "Group 2")
ax.legend()
# plt.show()