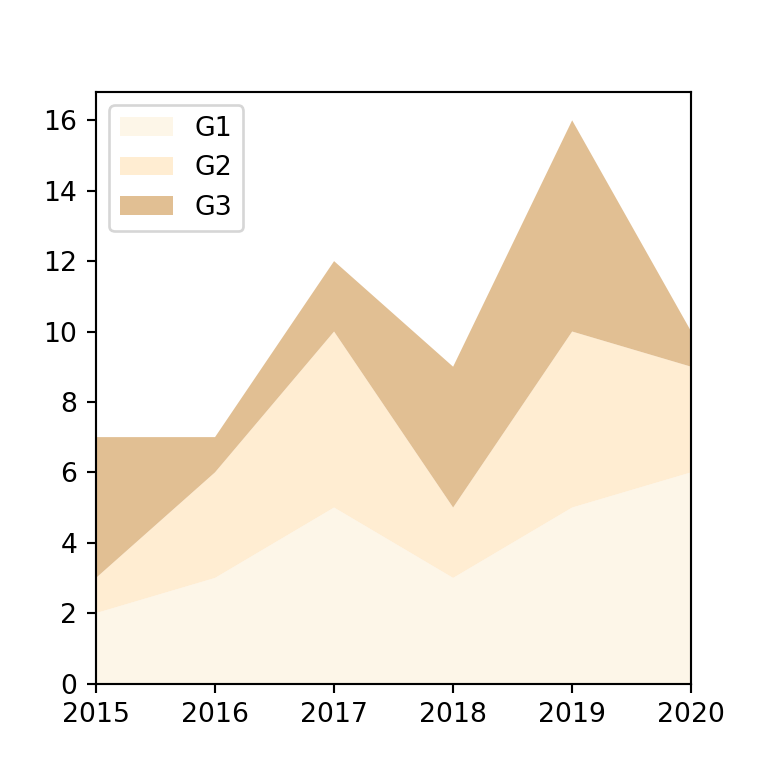
Area plot in matplotlib with fill_between
The fill_between function from matplotlib can be used to create a filled polygon between a curve and zero (by default). You just need to input to the data to the x and y1 arguments of the function.
import numpy as np
import matplotlib.pyplot as plt

# Data
x = range(1, 5)
y = [21, 12, 16, 10]

# Area plot
fig, ax = plt.subplots()
ax.fill_between(x = x, y1 = y)
# plt.show()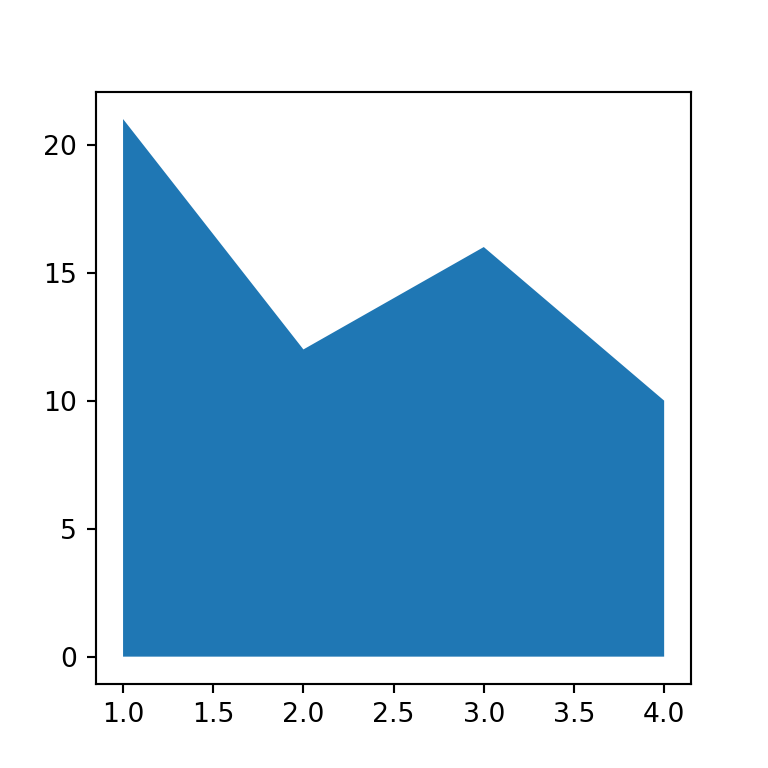
Line chart with filled area
Note that if you want a line chart with a filled area where the color of the line is different than the border of the area you will also need to pass the data to the plot function and customize the line as you want, as shown in the example below.
import numpy as np
import matplotlib.pyplot as plt

# Data
x = range(1, 5)
y = [21, 12, 16, 10]

# Area plot
fig, ax = plt.subplots()
ax.fill_between(x, y)
ax.plot(x, y, color = "k", linewidth = 1.5)
# plt.show()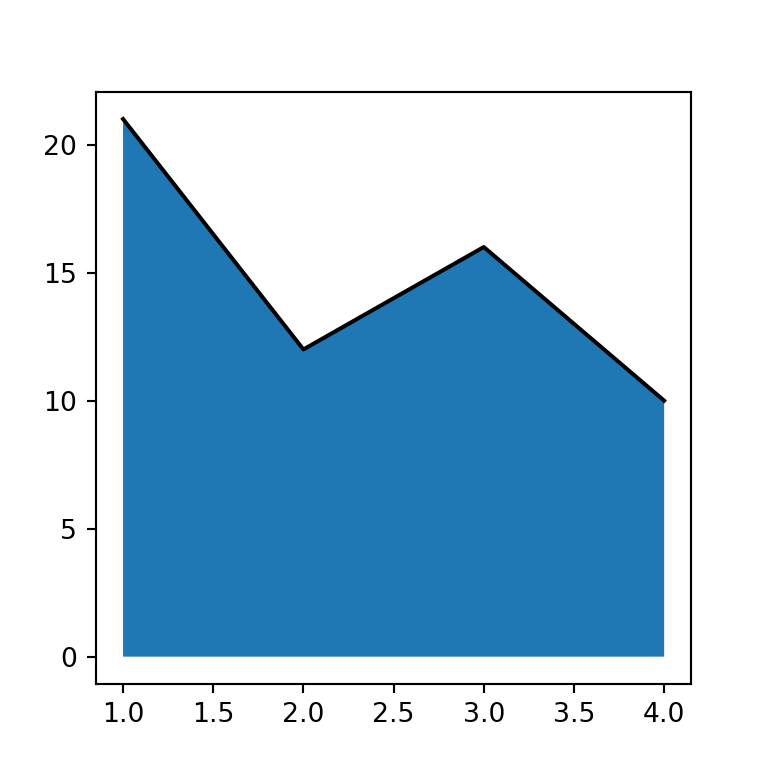
Transparency
The shaded area is opaque by default, but it is possible to customize the transparency of the area with the alpha argument, which ranges from 0 (transparent) to 1 (opaque).
import numpy as np
import matplotlib.pyplot as plt

# Data
x = range(1, 5)
y = [21, 12, 16, 10]

# Area plot
fig, ax = plt.subplots()
ax.fill_between(x, y, alpha = 0.5)
# plt.show()
Fill color
The default color of the area is blue, but the color argument allows specifying any color you want, as shown below.
import numpy as np
import matplotlib.pyplot as plt

# Data
x = range(1, 5)
y = [21, 12, 16, 10]

# Area plot
fig, ax = plt.subplots()
ax.fill_between(x, y, alpha = 0.5, color = "g")
# plt.show()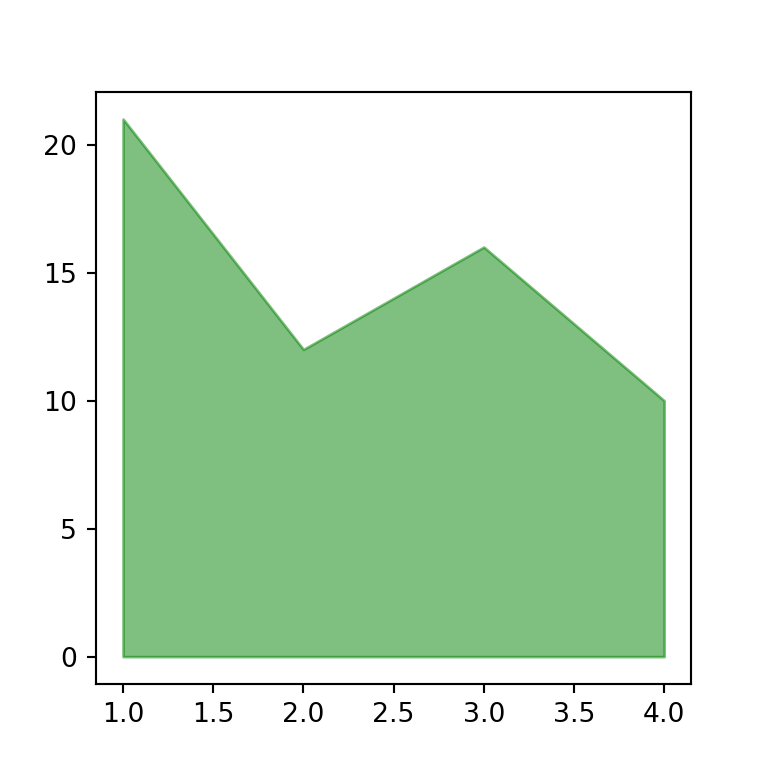
Border color
Note that you can also customize the border color and width of the area by using the edgecolor and linewidth arguments, respectively.
import numpy as np
import matplotlib.pyplot as plt

# Data
x = range(1, 5)
y = [21, 12, 16, 10]

# Area plot
fig, ax = plt.subplots()
ax.fill_between(x, y, alpha = 0.5, edgecolor = "r", linewidth = 2)
# plt.show()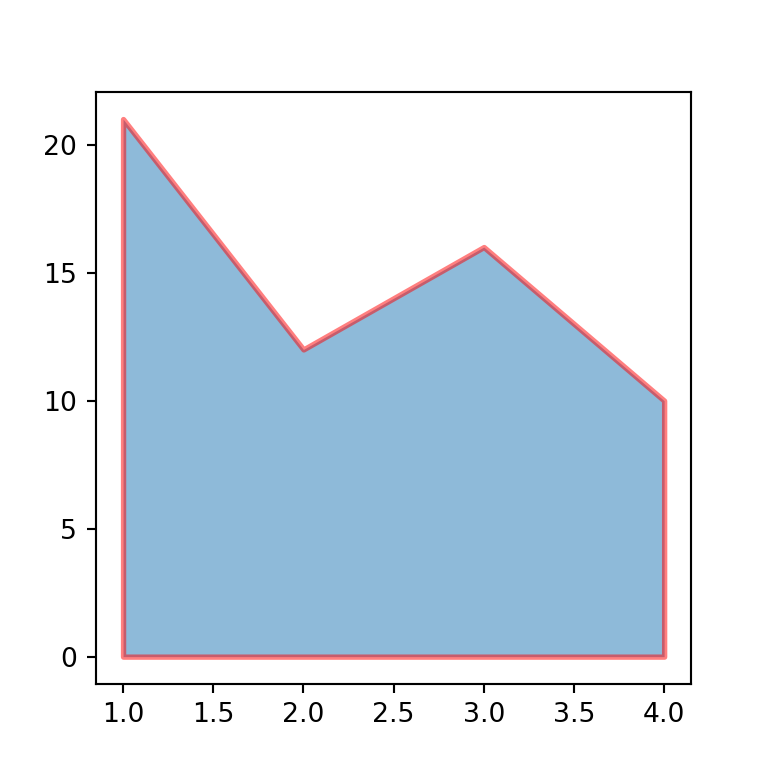
Fill the area between two lines
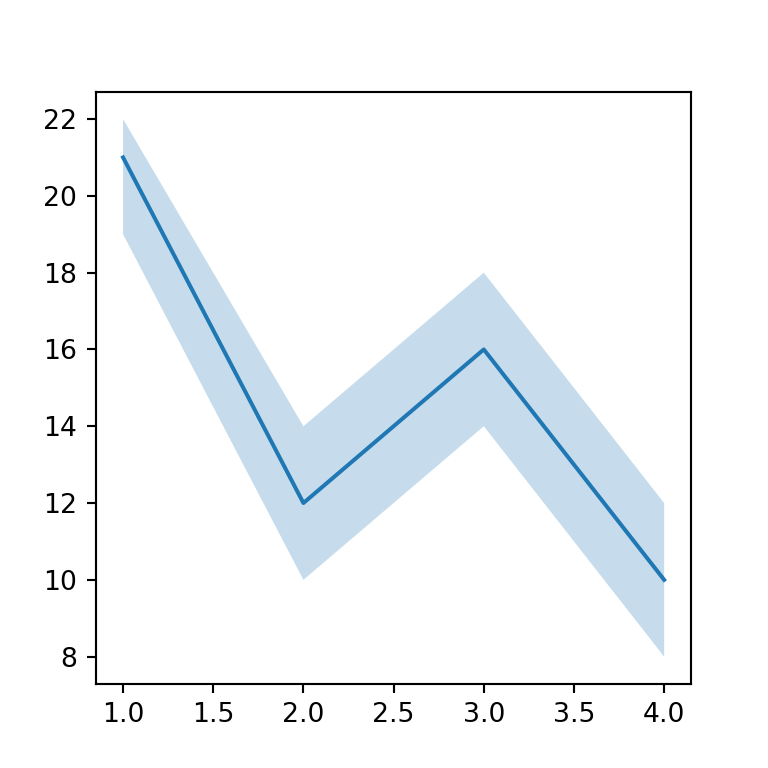
The fill_betwwen function not only shades the area of a single line. If you input a new line to the y2 argument the function will fill the area between y1 and y2.
import numpy as np
import matplotlib.pyplot as plt

# Data
x = range(1, 5)
y = [21, 12, 16, 10]
y1 = [19, 10, 14, 8]
y2 = [22, 14, 18, 12]

# Area plot
fig, ax = plt.subplots()
ax.fill_between(x, y1 = y1, y2 = y2, alpha = 0.25) # Polygon
ax.plot(x, y) # Line
# plt.show()

